
Page 85 - JCAU-7-2
P. 85
Journal of Chinese
Architecture and Urbanism Spatial network analysis of hutongs
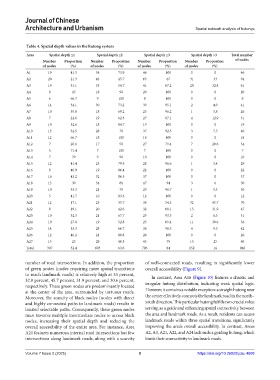
Table 4. Spatial depth values in the hutong system
Area Spatial depth ≤1 Spatial depth ≤2 Spatial depth ≤3 Spatial depth >3 Total number
Number Proportion Number Proportion Number Proportion Number Proportion of nodes
of nodes (%) of nodes (%) of nodes (%) of nodes (%)
A1 19 41.3 34 73.9 46 100 0 0 46
A2 20 21.3 43 45.7 63 67 31 33 94
A3 19 31.1 33 54.7 41 67.2 20 32.8 61
A4 9 45 18 90 20 100 0 0 20
A5 6 66.7 9 100 9 100 0 0 9
A6 14 34.1 30 73.2 39 95.1 2 4.9 41
A7 10 35.8 18 69.2 25 96.2 1 3.8 26
A8 7 22.6 19 62.3 27 87.1 4 12.9 31
A9 10 52.6 18 94.7 19 100 0 0 19
A10 13 32.5 28 70 37 92.5 3 7.5 40
A11 12 66.7 18 100 18 100 0 0 18
A12 7 20.6 17 50 27 79.4 7 20.6 34
A13 5 71.4 7 100 7 100 0 0 7
A14 7 70 9 90 10 100 0 0 10
A15 12 41.4 23 79.3 28 96.6 1 3.4 29
A16 9 40.9 19 86.4 22 100 0 0 22
A17 16 43.2 32 86.5 37 100 0 0 37
A18 15 30 34 68 47 94 3 6 50
A19 10 33.3 21 70 29 96.7 1 3.3 30
A20 5 41.7 10 83.3 12 100 0 0 12
A21 12 17.1 25 35.7 38 54.3 32 45.7 70
A22 9 19.1 20 42.6 32 68.1 15 31.9 47
A23 10 32.3 21 67.7 29 93.5 2 6.5 31
A24 10 27.8 19 52.8 25 69.4 11 30.6 36
A25 14 33.3 28 66.7 38 90.5 4 9.5 42
A26 12 46.2 21 80.8 26 100 0 0 26
A27 15 25 29 48.3 45 75 15 25 60
Total 307 32.4 603 63.6 796 84 152 16 948
number of road intersections. In addition, the proportion of well-connected roads, resulting in significantly lower
of green nodes (nodes requiring more spatial transitions overall accessibility (Figure 9).
to reach landmark roads) is relatively high at 33 percent, In contrast, Area A16 (Figure 10) features a chaotic and
32.8 percent, 45.7 percent, 31.9 percent, and 30.6 percent,
respectively. These green nodes are predominantly located irregular hutong distribution, indicating weak spatial logic.
at the center of the area, surrounded by tortuous roads. However, it contains a notable exception: a straight hutong near
Moreover, the scarcity of black nodes (nodes with direct the center effectively connects the landmark road in the north–
and highly connected paths to landmark roads) results in south direction. This particular hutong fulfills two crucial roles:
limited selectable paths. Consequently, these green nodes serving as a guide and enhancing spatial connectivity between
must traverse multiple intermediate nodes to access black the area and landmark roads. As a result, residents can access
nodes, increasing their spatial depth and reducing the landmark roads within three spatial transitions, significantly
overall accessibility of the entire area. For instance, Area improving the area’s overall accessibility. In contrast, Areas
A21 features numerous internal road intersections but few A2, A3, A21, A22, and A24 lack such a guiding hutong, which
intersections along landmark roads, along with a scarcity limits their connectivity to landmark roads.
Volume 7 Issue 2 (2025) 8 https://doi.org/10.36922/jcau.4608