
Page 87 - JCAU-7-2
P. 87
Journal of Chinese
Architecture and Urbanism Spatial network analysis of hutongs
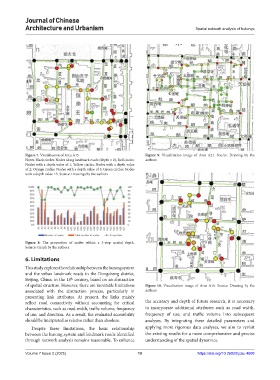
Figure 7. Visualization of Area A15 Figure 9. Visualization image of Area A21. Source: Drawing by the
Notes: Black circles: Nodes along landmark roads (depth = 0); Red circles: authors
Nodes with a depth value of 1; Yellow circles: Nodes with a depth value
of 2; Orange circles: Nodes with a depth value of 3; Green circles: Nodes
with a depth value >3. Source: Drawings by the authors
Figure 8. The proportion of nodes within a 3-step spatial depth.
Source: Graph by the authors
6. Limitations
This study explores the relationship between the hutong system
and the urban landmark roads in the Dongcheng district,
Beijing, China, in the 18 century, based on an abstraction
th
of spatial structure. However, there are inevitable limitations Figure 10. Visualization image of Area A16. Source: Drawing by the
associated with the abstraction process, particularly in authors
presenting link attributes. At present, the links mainly
reflect road connectivity without accounting for critical the accuracy and depth of future research, it is necessary
characteristics, such as road width, traffic volume, frequency to incorporate additional attributes such as road width,
of use, and direction. As a result, the evaluated accessibility frequency of use, and traffic volume into subsequent
should be interpreted as relative rather than absolute. analyses. By integrating these detailed parameters and
Despite these limitations, the basic relationship applying more rigorous data analyses, we aim to revisit
between the hutong system and landmark roads identified the existing results for a more comprehensive and precise
through network analysis remains reasonable. To enhance understanding of the spatial dynamics.
Volume 7 Issue 2 (2025) 10 https://doi.org/10.36922/jcau.4608