
Page 84 - JCAU-7-2
P. 84
Journal of Chinese
Architecture and Urbanism Spatial network analysis of hutongs
Finally, the number 1 represents a single node with a
spatial depth exceeding three steps from the origin point,
marked in green in Figure 7. This constitutes 3.4 percent
of the total number of nodes, excluding the origin point.
The final row of Table 4 summarizes the total number
of nodes at various depth values across all areas. For
example, the number 307 represents the total number
of nodes located at a depth of one step from the origin
point across all areas, while the number 948 indicates
the total number of nodes, excluding the origin point.
The percentage reflects the proportion of nodes at a
specific depth relative to the total number of nodes,
excluding the origin across all areas. For instance, 32.4
percent represents the proportion of nodes at a 1-step
depth (307 nodes) compared to all nodes excluding the
origin (948 nodes).
The results of the spatial depth value analysis (Table 4)
show that the hutong system has evolved into a network
structure consisting of 948 nodes, composing links and
nodes. Among these, 796 nodes are located within a
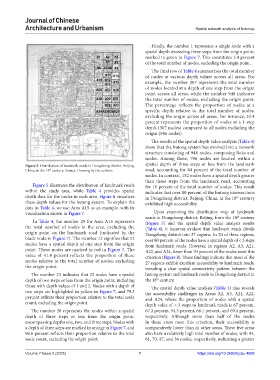
Figure 5. Distribution of landmark roads in Dongcheng district, Beijing, spatial depth of three steps or less from the landmark
China, in the 18 century. Source: Drawing by the authors road, accounting for 84 percent of the total number of
th
nodes. In contrast, 152 nodes have a spatial depth greater
than three steps from the landmark road, accounting
Figure 5 illustrates the distribution of landmark roads for 16 percent of the total number of nodes. This result
within the study area, while Table 4 provides spatial indicates that over 80 percent of the hutong intersections
depth data for the nodes in each area. Figure 6 visualizes in Dongcheng district, Beijing, China, in the 18 century
th
these depth values for the hutong system. To explain the exhibited high accessibility.
data in Table 4, we use Area A15 as an example, with its
visualization shown in Figure 7. Upon examining the distribution map of landmark
roads in Dongcheng district, Beijing, from the 18 century
th
In Table 4, the number 29 for Area A15 represents (Figure 5) and the spatial depth value analysis results
the total number of nodes in the area, excluding the (Table 4), it becomes evident that landmark roads divide
origin point on the landmark road (indicated by the Dongcheng district into 27 regions. In 20 of these regions,
black node in Figure 7). The number 12 signifies that 12 over 80 percent of the nodes have a spatial depth of < 3 steps
nodes have a spatial depth of one step from the origin from landmark roads. However, in regions A2, A3, A21,
point. These nodes are marked in red in Figure 7. The A22, and A24, fewer than 70 percent of the nodes meet this
value of 41.4 percent reflects the proportion of these criterion (Figure 8). These findings indicate that most of the
nodes relative to the total number of nodes, excluding 27 regions exhibit excellent accessibility to landmark roads,
the origin point. revealing a clear spatial connectivity pattern between the
The number 23 indicates that 23 nodes have a spatial hutong system and landmark roads in Dongcheng district in
depth of two steps or less from the origin point, including the 18 century.
th
those with depth values of 1 and 2. Nodes with a depth of The spatial depth value analysis (Table 4) also reveals
two steps are highlighted in yellow in Figure 7, and 79.3 the accessibility challenges in Areas A2, A3, A21, A22,
percent reflects their proportion relative to the total node and A24, where the proportion of nodes with a spatial
count, excluding the origin point. depth value of < 3 steps to landmark roads is 67 percent,
The number 28 represents the nodes within a spatial 67.2 percent, 54.3 percent, 68.1 percent, and 69.4 percent,
depth of three steps or less from the origin point, respectively. Although more than half of the nodes
encompassing depths one, two, and three steps. Nodes with in these areas meet this criterion, their accessibility is
a depth of three steps are marked in orange in Figure 7, and comparatively lower than in other areas. These five areas
96.6 percent reflects their proportion relative to the total also have a relatively high total number of nodes, with 94,
node count, excluding the origin point. 61, 70, 47, and 36 nodes, respectively, indicating a greater
Volume 7 Issue 2 (2025) 7 https://doi.org/10.36922/jcau.4608