
Page 46 - JCBP-2-1
P. 46
Journal of Clinical and
Basic Psychosomatics Depressive disorder obstructive sleep apnea hypothalamic inflammation
2.4. Image processing and analysis using the median and analyzed using the rank-sum test.
Scanning was performed using a GE Discovery MR750W Correlation analysis of non-bivariate normal distribution
3.0T magnetic resonance imager at the Affiliated Changzhou data was performed using Pearson’s correlation analysis.
No. 2 People’s Hospital of Nanjing Medical University, 3. Results
Changzhou. The scanning parameters and methods employed
[10]
in this study have been described in our previous studies . 3.1. Demographic and clinical characteristics of
The ITK-SNAP software (developed by the University of participants
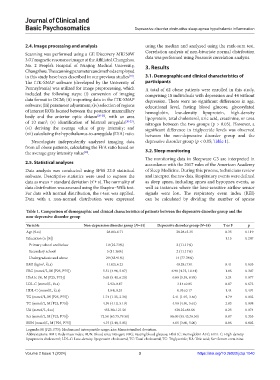
Pennsylvania) was utilized for image preprocessing, which A total of 62 obese patients were enrolled in this study,
included the following steps: (i) conversion of imaging comprising 18 individuals with depression and 44 without
data format to DCM; (ii) importing data in the ITK-SNAP depression. There were no significant differences in age,
software; (iii) parameter adjustment; (iv) selection of regions educational level, fasting blood glucose, glycosylated
of interest ROIs located between the posterior mammillary hemoglobin, low-density lipoprotein, high-density
body and the anterior optic chiasm [20-23] , with an area lipoprotein, total cholesterol, uric acid, creatinine, or urea
of 10 mm ; (v) identification of bilateral amygdala [20-23] ; nitrogen between the two groups (p > 0.05). However, a
2
(vi) deriving the average value of gray intensity; and significant difference in triglyceride levels was observed
(vii) calculating the hypothalamus-to-amygdala (H/A) ratio. between the non-depressive disorder group and the
Neurologists independently analyzed imaging data depressive disorder group (p < 0.05; Table 1).
from all obese patients, calculating the H/A ratio based on
the average gray intensity value . 3.2. Sleep monitoring
[10]
The monitoring data in Sleepware G3 are interpreted in
2.5. Statistical analyses accordance with the 2017 rules of the American Academy
Data analysis was conducted using SPSS 22.0 statistical of Sleep Medicine. During this process, technicians review
software. Descriptive statistics were used to express the and interpret the raw data. Respiratory events were defined
data as mean ± standard deviation (x̄ ± s). The normality of as sleep apnea, including apnea and hypopnea events, as
data distribution was assessed using the Shapiro–Wilk test. well as instances where the heat-sensitive airflow sensor
For data with normal distribution, the t-test was applied. signals were lost. The respiratory event index (REI)
Data with a non-normal distribution were expressed can be calculated by dividing the number of apneas
Table 1. Comparison of demographic and clinical characteristics of patients between the depressive disorder group and the
non‑depressive disorder group
Variable Non‑depression disorder group (N=44) Depressive disorder group (N=18) T or F p
-
Age (x±s) 28.86±6.71 28.28±5.35 0.33 0.119
Education (n [%]) 1.15 0.287
Primary school and below 10 (22.73%) 2 (11.11%)
Secondary school 5 (11.36%) 2 (11.11%)
Undergraduate and above 29 (65.91%) 14 (77.78%)
2 -
BMI (kg/m , x±s) 41.02±6.23 40.28±7.01 0.41 0.635
FBG (mmol/L, M [P25, P75]) 5.51 (4.96, 5.87) 6.98 (4.75, 10.44) 1.06 0.307
HbA1c (%, M [P25, P75]) 5.65 (5.40, 6.20) 6.80 (5.55, 8.95) 3.24 0.077
-
LDL-C (mmol/L, x±s) 2.92±0.87 3.14±0.85 0.87 0.673
-
HDL-C (mmol/L, x±s) 1.04±0.24 0.95±0.17 1.44 0.491
TG (mmol/L, M [P25, P75]) 1.74 (1.35, 2.38) 2.41 (1.97, 3.46) 4.79 0.032
TC (mmol/L, M [P25, P75]) 4.59 (4.10, 5.19) 4.90 (4.40, 5.61) 2.83 0.098
-
UA (mmol/L, x±s) 435.36±121.56 428.22±88.68 0.23 0.074
Scr (mmol/L, M [P25, P75]) 72.50 (63.75,79.50) 66.00 (55.43,76.50) 0.87 0.355
BUN (mmol/L, M [P25, P75]) 4.15 (3.48, 5.05) 4.05 (3.60, 5.00) 0.06 0.802
-
Legends: M [P25, P75]: Median and interquartile range; x±s: Mean±standard deviation.
Abbreviations: BMI: Body mass index; BUN: Blood urea nitrogen; FBG: Fasting blood glucose; HbA1C: Hemoglobin A1C; HDL-C: High-density
lipoprotein cholesterol; LDL-C: Low-density lipoprotein cholesterol; TC: Total cholesterol; TG: Triglyceride; UA: Uric acid; Scr: Serum creatinine.
Volume 2 Issue 1 (2024) 3 https://doi.org/10.36922/jcbp.1040