
Page 47 - JCBP-2-1
P. 47
Journal of Clinical and
Basic Psychosomatics Depressive disorder obstructive sleep apnea hypothalamic inflammation
and hypopneas recorded by the total monitoring time. SI ratio displayed correlations with REI, BMI, and ODI
Notably, when comparing obese young male patients with (p < 0.05; Figures 6-8). Conversely, no correlation was
and without depressive disorder, statistically significant found between the left H/A SI ratio and the lowest oxygen
differences were observed in several key parameters, saturation (p > 0.05; Figure 9).
including REI (apnea-hypopnea index [AHI]), lowest
oxygen saturation, maximum duration of sleep apnea, and 4. Discussion
oxygen desaturation index (ODI) (p < 0.05). Conversely, This study has identified the association between depressive
other parameters such as time in bed, maximum duration disorders, values of REI and ODI, and H/A ratio in young
of sleep apnea, actual sleep time, maximum duration of obese male patients. Furthermore, there is a positive
hypoventilation, and ODI did not exhibit statistically correlation observed between an increase in the left H/A
significant differences between the two groups (p > 0.05) SI ratio and both REI and BMI.
(Table 2).
The previous studies have indicated that obese
[25]
3.3. Correlation of depressive disorder on bilateral patients are at a heightened risk of experiencing sleep
hypothalamic inflammation disorders, particularly insomnia and OSA. One of the
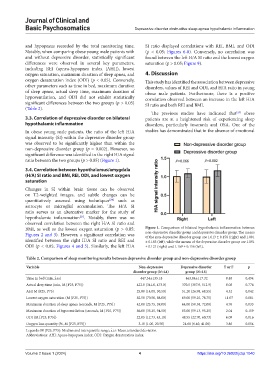
In obese young male patients, the ratio of the left H/A studies has demonstrated that in the absence of emotional
signal intensity (SI) within the depressive disorder group
was observed to be significantly higher than within the
non-depressive disorder group (p = 0.002). However, no
significant difference was identified in the right H/A signal
ratio between the two groups (p > 0.05) (Figure 1).
3.4. Correlation between hypothalamus/amygdala
(H/A) SI ratio and BMI, REI, ODI, and lowest oxygen
saturation
Changes in SI within brain tissue can be observed
on T2-weighted images, and subtle changes can be
[24]
quantitatively assessed using techniques such as
astrocyte or microglial accumulation. The H/A SI
ratio serves as an alternative marker for the study of
hypothalamic inflammation . Notably, there was no
[21]
observed correlation between the right H/A SI ratio and
BMI, as well as the lowest oxygen saturation (p > 0.05; Figure 1. Comparison of bilateral hypothalamic inflammation between
Figures 2 and 3). However, a significant correlation was non-depressive disorder group and depressive disorder group. The means
of the non-depressive disorder group are 1.013 ± 0.158 (right) and 1.001
identified between the right H/A SI ratio and REI and ± 0.183 (left), while the means of the depressive disorder group are 1.091
ODI (p < 0.05; Figures 4 and 5). Similarly, the left H/A ± 0.121 (right) and 1.169 ± 0.156 (left).
Table 2. Comparison of sleep monitoring results between depressive disorder group and non‑depressive disorder group
Variable Non‑depressive Depressive disorder T or F p
disorder group (N=44) group (N=18)
-
Time in bed (min, x±s) 447.34±135.18 463.84±117.32 0.48 0.494
Actual sleep time (min, M [P25, P75)) 422.0 (341.0, 473.0) 370.5 (307.9, 512.9) 0.08 0.776
AHI M (P25, P75) 25.80 (14.08, 50.50) 51.20 (26.98, 68.55) 4.32 0.042
Lowest oxygen saturation (M [P25, P75]) 82.50 (70.50, 88.00) 69.00 (59.25, 78.75) 11.07 0.001
Maximum duration of sleep apnea (seconds, M [P25, P75]) 42.00 (25.75, 59.00) 64.00 (50.38, 72.00) 4.76 0.033
Maximum duration of hypoventilation (seconds, M [P25, P75]) 86.00 (35.25, 94.50) 83.00 (59.13, 95.25) 2.04 0.159
ODI (M [P25, P75]) 22.05 (12.73, 43.10) 48.55 (22.70, 60.73) 6.09 0.016
Oxygen loss quantity (%, M [P25, P75]) 3.10 (1.00, 20.50) 24.60 (6.40, 41.00) 3.86 0.054
-
Legends: M [P25, P75]: Median and interquartile range; x±s: Mean±standard deviation.
Abbreviations: AHI: Apnea-hypopnea index; ODI: Oxygen desaturation index.
Volume 2 Issue 1 (2024) 4 https://doi.org/10.36922/jcbp.1040