
Page 47 - JCBP-2-2
P. 47
Journal of Clinical and
Basic Psychosomatics Alexithymia as a mediator relationship
of SPS (moderate-SPS); and 248 participants (30.5%) had occupation (P < 0.01). Notably, gender exhibited an effect
a score strictly above 137, signifying a high level of SPS on health anxiety (P < 0.05). In addition, we observed the
(high-SPS). In terms of alexithymia scores, the range fell effects of age (P < 0.001), education level (P < 0.001), and
within a range between a minimum of 21 and a maximum occupation (P < 0.001) on alexithymia. In summary, women
of 91, with a mean score of 51.31 (SD = 11.98). Specifically, reported significantly higher levels of sensitivity and health
518 participants (63.64%) obtained a score below 56, anxiety, while older participants tended to report lower
while 296 (36.36%) obtained a score of 56 or higher, levels of sensitivity and alexithymia. Participants with
prompting consideration that they might express a form higher educational attainment (4-year bachelor’s degree or
of alexithymia. a master’s degree and above) reported lower alexithymia
scores than those with lower levels of education. Moreover,
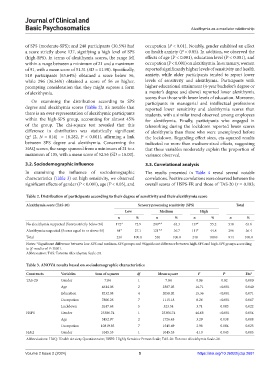
On examining the distribution according to SPS participants in managerial and intellectual professions
degree and alexithymia scores (Table 2), it’s notable that reported lower sensitivity and alexithymia scores than
there is an over-representation of alexithymic participants students, with a similar trend observed among employees
within the high-SPS group, accounting for almost 45% for alexithymia. Finally, participants who engaged in
of the group. The chi-square test revealed that this teleworking during the lockdown reported lower scores
difference in distribution was statistically significant of alexithymia than those who were unemployed before
(χ [2, N = 814] = 16.282, P < 0.001), affirming a link the lockdown. Regarding effect sizes, eta-squared results
2
between SPS degree and alexithymia. Concerning the indicated no more than medium-sized effects, suggesting
HAQ scores, the range spanned from a minimum of 21 to a that these variables moderately explain the proportion of
maximum of 105, with a mean score of 52.56 (SD = 16.00). variance observed.
3.2. Sociodemographic influence 3.3. Correlational analysis
In examining the influence of sociodemographic The results presented in Table 4 reveal several notable
characteristics (Table 3) on high sensitivity, we observed correlations. Positive correlations were observed between the
significant effects of gender (P < 0.001), age (P < 0.05), and overall scores of HSPS-FR and those of TAS-20 (r = 0.183;
Table 2. Distribution of participants according to their degree of sensitivity and their alexithymia score
Alexithymia score (TAS‑20) Sensory processing sensitivity (SPS) Total
Low Medium High
n % n % n % n %
No alexithymia suspected (Scores strictly below 56) 172* 72.9 209* ,# 63.3 137 # 55.2 518 63.6
Alexithymia suspected (Scores equal to or above 56) 64* 27.1 121* ,# 36.7 111 # 44.8 296 36.4
Total 236 100.0 330 100.0 248 100.0 814 100.0
Notes: *Significant difference between low-SPS and medium-SPS groups and #Significant difference between high-SPS and high-SPS groups according
2
to χ results of P<0.001.
Abbreviation: TAS: Toronto Alexithymia Scale-20.
Table 3. ANOVA results based on sociodemographic characteristics
Constructs Variables Sum of squares df Mean square F P Eta 2
TAS-20 Gender 7.84 1 7.84 0.06 0.82 0.000
Age 4614.06 2 2307.03 16.71 <0.001 0.040
Education 8232.08 4 2058.02 15.36 <0.001 0.071
Occupation 7806.26 7 1115.18 8.26 <0.001 0.067
Lockdown 2617.68 5 523.54 3.71 0.003 0.022
HSPS Gender 23306.74 1 23306.74 46.68 <0.001 0.054
Age 3452.97 2 1726.48 3.29 0.038 0.008
Occupation 10819.85 7 1545.69 2.98 0.004 0.025
HAQ Gender 1045.35 1 1045.35 4.10 0.043 0.005
Abbreviations: HAQ: Health Anxiety Questionnaire; HSPS: Highly Sensitive Person Scale; TAS-20: Toronto Alexithymia Scale-20.
Volume 2 Issue 2 (2024) 5 https://doi.org/10.36922/jcbp.2681