
Page 67 - JCBP-3-1
P. 67
Journal of Clinical and
Basic Psychosomatics Protein and sleep problem
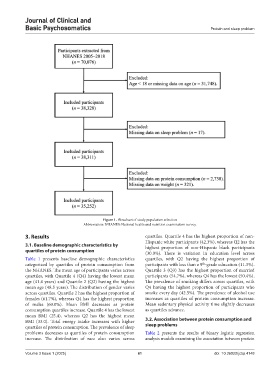
Figure 1. Flowchart of study population selection
Abbreviation: NHANES: National health and nutrition examination survey.
3. Results quartiles. Quartile 4 has the highest proportion of non-
Hispanic white participants (42.3%), whereas Q2 has the
3.1. Baseline demographic characteristics by highest proportion of non-Hispanic black participants
quartiles of protein consumption (30.0%). There is variation in education level across
Table 1 presents baseline demographic characteristics quartiles, with Q2 having the highest proportion of
th
categorized by quartiles of protein consumption from participants with less than a 9 -grade education (11.3%).
the NHANES. The mean age of participants varies across Quartile 3 (Q3) has the highest proportion of married
quartiles, with Quartile 4 (Q4) having the lowest mean participants (54.7%), whereas Q4 has the lowest (50.4%).
age (41.4 years) and Quartile 2 (Q2) having the highest The prevalence of smoking differs across quartiles, with
mean age (48.5 years). The distribution of gender varies Q4 having the highest proportion of participants who
across quartiles. Quartile 2 has the highest proportion of smoke every day (42.5%). The prevalence of alcohol use
females (61.7%), whereas Q4 has the highest proportion increases as quartiles of protein consumption increase.
of males (60.0%). Mean BMI decreases as protein Mean sedentary physical activity time slightly decreases
consumption quartiles increase. Quartile 4 has the lowest as quartiles advance.
mean BMI (25.4), whereas Q2 has the highest mean
BMI (33.0). Total energy intake increases with higher 3.2. Association between protein consumption and
quartiles of protein consumption. The prevalence of sleep sleep problems
problems decreases as quartiles of protein consumption Table 2 presents the results of binary logistic regression
increase. The distribution of race also varies across analysis models examining the association between protein
Volume 3 Issue 1 (2025) 61 doi: 10.36922/jcbp.4148