
Page 68 - JCBP-3-1
P. 68
Journal of Clinical and
Basic Psychosomatics Protein and sleep problem
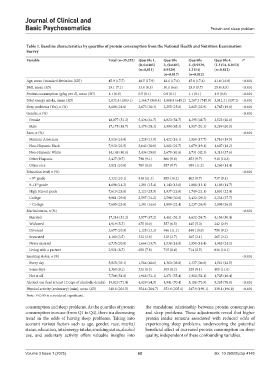
Table 1. Baseline characteristics by quartiles of protein consumption from the National Health and Nutrition Examination
Survey
Variable Total (n=35,252) Quartile 1, Quartile Quartile Quartile 4, P
(0, 0.6485) 2, (0.6485, 3, (0.9329, (1.3154, 8.1053)
(n=8,811) 0.9329) 1.3154) (n=8,812)
(n=8,817) (n=8,812)
Age, mean (standard deviation [SD]) 45.9 (17.7) 48.5 (17.9) 48.1 (17.6) 45.8 (17.4) 41.4 (16.8) <0.001
BMI, mean (SD) 29.1 (7.1) 33.0 (8.3) 30.1 (6.6) 28.0 (5.7) 25.4 (4.9) <0.001
Protein consumption (g/kg per d), mean (SD) 1.1 (0.6) 0.5 (0.1) 0.8 (0.1) 1.1 (0.1) 1.9 (0.6) <0.001
Total energy intake, mean (SD) 2,032.4 (1003.1) 1,364.7 (568.4) 1,888.8 (645.2) 2,267.3 (745.9) 3,012.2 (1137.2) <0.001
Sleep problems (Yes), n (%) 8,688 (24.6) 2,673 (30.3) 2,255 (25.6) 2,015 (22.9) 1,745 (19.8) <0.001
Gender, n (%) <0.001
Female 18,077 (51.3) 5,436 (61.7) 4,823 (54.7) 4,295 (48.7) 3,523 (40.0)
Male 17,175 (48.7) 3,375 (38.3) 3,994 (45.3) 4,517 (51.3) 5,289 (60.0)
Race, n (%) <0.001
Mexican American 5,926 (16.8) 1,228 (13.9) 1,422 (16.1) 1,560 (17.7) 1,716 (19.5)
Non-Hispanic Black 7,930 (22.5) 2,642 (30.0) 2,002 (22.7) 1,679 (19.1) 1,607 (18.2)
Non-Hispanic White 14,148 (40.1) 3,434 (39.0) 3,670 (41.6) 3,731 (42.3) 3,313 (37.6)
Other Hispanic 3,427 (9.7) 798 (9.1) 866 (9.8) 853 (9.7) 910 (10.3)
Other race 3,821 (10.8) 709 (8.0) 857 (9.7) 989 (11.2) 1,266 (14.4)
Education level, n (%) <0.001
th
< 9 grade 3,332 (10.1) 938 (11.3) 855 (10.2) 802 (9.7) 737 (9.1)
9–11 grade 4,698 (14.2) 1,281 (15.4) 1,143 (13.6) 1,088 (13.1) 1,186 (14.7)
th
High School grade 7,610 (23.0) 2,123 (25.5) 1,937 (23.0) 1,749 (21.1) 1,801 (22.4)
College 9,861 (29.8) 2,597 (31.2) 2,598 (30.8) 2,432 (29.3) 2,234 (27.7)
> College 7,605 (23.0) 1,381 (16.6) 1,889 (22.4) 2,237 (26.9) 2,098 (26.0)
Marital status, n (%) <0.001
Married 17,216 (51.2) 3,977 (47.2) 4,461 (52.3) 4,622 (54.7) 4,156 (50.4)
Widowed 1,919 (5.7) 675 (8.0) 557 (6.5) 445 (5.3) 242 (2.9)
Divorced 3,677 (10.9) 1,125 (13.3) 946 (11.1) 848 (10.0) 758 (9.2)
Separated 1,180 (3.5) 332 (3.9) 318 (3.7) 265 (3.1) 265 (3.2)
Never married 6,735 (20.0) 1,664 (19.7) 1,538 (18.0) 1,550 (18.4) 1,983 (24.1)
Living with a partner 2,921 (8.7) 656 (7.8) 715 (8.4) 714 (8.5) 836 (10.1)
Smoking status, n (%) <0.001
Every day 5,825 (39.1) 1,564 (40.6) 1,363 (36.8) 1,337 (36.8) 1,561 (42.5)
Some days 1,360 (9.1) 321 (8.3) 305 (8.2) 329 (9.1) 405 (11.0)
Not at all 7,708 (51.8) 1,968 (51.1) 2,071 (55.4) 1,964 (54.1) 1,705 (46.4)
Alcohol use (had at least 12 cups of alcoholic drinks) 19,823 (71.4) 4,429 (64.5) 4,941 (70.4) 5,188 (73.9) 5,265 (76.8) <0.001
Physical activity (sedentary) (min), mean (SD) 348.6 (201.5) 354.4 (204.7) 353.6 (205.1) 347.9 (199.1) 338.4 (196.8) <0.001
Note: P<0.05 is considered significant.
consumption and sleep problems. As the quartiles of protein the standalone relationship between protein consumption
consumption increase (from Q1 to Q4), there is a decreasing and sleep problems. These adjustments reveal that higher
trend in the odds of having sleep problems. Taking into protein intake remains associated with reduced odds of
account various factors such as age, gender, race, marital experiencing sleep problems, underscoring the potential
status, education, total energy intake, smoking status, alcohol beneficial effect of increased protein consumption on sleep
use, and sedentary activity offers valuable insights into quality, independent of these confounding variables.
Volume 3 Issue 1 (2025) 62 doi: 10.36922/jcbp.4148