
Page 69 - JCBP-3-1
P. 69
Journal of Clinical and
Basic Psychosomatics Protein and sleep problem
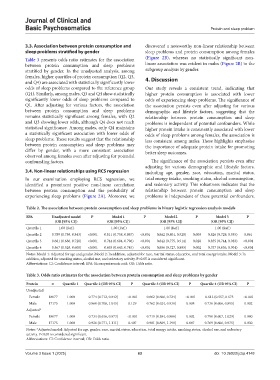
3.3. Association between protein consumption and discovered a noteworthy non-linear relationship between
sleep problems stratified by gender sleep problems and protein consumption among females
Table 3 presents odds ratio estimates for the association (Figure 2B), whereas no statistically significant non-
between protein consumption and sleep problems linear association was evident in males (Figure 2B) in the
stratified by gender. In the unadjusted analysis, among subgroup analysis by gender.
females, higher quartiles of protein consumption (Q2, Q3, 4. Discussion
and Q4) are associated with statistically significantly lower
odds of sleep problems compared to the reference group Our study reveals a consistent trend, indicating that
(Q1). Similarly, among males, Q3 and Q4 show statistically higher protein consumption is associated with lower
significantly lower odds of sleep problems compared to odds of experiencing sleep problems. The significance of
Q1. After adjusting for various factors, the association the association persists even after adjusting for various
between protein consumption and sleep problems demographic and lifestyle factors, suggesting that the
remains statistically significant among females, with Q2 relationship between protein consumption and sleep
and Q3 showing lower odds, although Q4 does not reach problems is independent of potential confounders. While
statistical significance. Among males, only Q4 maintains higher protein intake is consistently associated with lower
a statistically significant association with lower odds of odds of sleep problems among females, the association is
sleep problems. These results suggest that the relationship less consistent among males. These highlights emphasize
between protein consumption and sleep problems may the importance of adequate protein intake for promoting
differ by gender, with a more consistent association better sleep outcomes.
observed among females even after adjusting for potential
confounding factors. The significance of the association persists even after
adjusting for various demographic and lifestyle factors,
3.4. Non-linear relationships using RCS regression including age, gender, race, education, marital status,
In our examination employing RCS regression, we total energy intake, smoking status, alcohol consumption,
identified a prominent positive non-linear correlation and sedentary activity. This robustness indicates that the
between protein consumption and the probability of relationship between protein consumption and sleep
experiencing sleep problems (Figure 2A). Moreover, we problems is independent of these potential confounders.
Table 2. The association between protein consumption and sleep problems in binary logistic regression analysis models
EPA Unadjusted model P Model 1 P Model 2 P Model 3 P
(OR [95% CI]) (OR [95% CI]) (OR [95% CI]) (OR [95% CI])
Quartile 1 1.00 (Ref.) 1.00 (Ref.) 1.00 (Ref.) 1.00 (Ref.)
Quartile 2 0.789 (0.739, 0.843) <0.001 0.811 (0.758, 0.867) <0.001 0.862 (0.801, 0.928) 0.003 0.826 (0.729, 0.935) 0.061
Quartile 3 0.681 (0.636, 0.728) <0.001 0.744 (0.694, 0.796) <0.001 0.842 (0.775, 0.914) 0.028 0.855 (0.744, 0.983) <0.001
Quartile 4 0.567 (0.529, 0.608) <0.001 0.693 (0.645, 0.745) <0.001 0.806 (0.727, 0.893) 0.002 0.757 (0.636, 0.901) <0.001
Notes: Model 1: Adjusted for age and gender. Model 2: In addition, adjusted for race, marital status, education, and total energy intake. Model 3: In
addition, adjusted for smoking status, alcohol use, and sedentary activity. P<0.05 is considered significant.
Abbreviations: CI: Confidence interval; EPA: Eicosapentaenoic acid; OR: Odds ratio.
Table 3. Odds ratio estimates for the association between protein consumption and sleep problems by gender
Protein n Quartile 1 Quartile 2 (OR 95% CI) P Quartile 3 (OR 95% CI) P Quartile 4 (OR 95% CI) P
Unadjusted
Female 18077 1.000 0.774 (0.712, 0.842) <0.001 0.662 (0.606, 0.724) <0.001 0.613 (0.557, 0.675 <0.001
Male 17175 1.000 0.860 (0.708, 1.045) 0.129 0.762 (0.624, 0.930) 0.008 0.736 (0.606, 0.895) 0.002
Adjusted*
Female 18077 1.000 0.734 (0.616, 0.873) <0.001 0.719 (0.584, 0.886) 0.002 0.790 (0.607, 1.029) 0.080
Male 17175 1.000 0.926 (0.771, 1.111) 0.407 0.981 (0.809, 1.190) 0.847 0.769 (0.606, 0.975) 0.030
Notes: *Adjusted model: Adjusted for age, gender, race, marital status, education, total energy intake, smoking status, alcohol use, and sedentary
activity. P<0.05 is considered significant.
Abbreviations: CI: Confidence interval; OR: Odds ratio.
Volume 3 Issue 1 (2025) 63 doi: 10.36922/jcbp.4148