
Page 85 - JCBP-3-1
P. 85
Journal of Clinical and
Basic Psychosomatics HDL markers and suicidal ideation
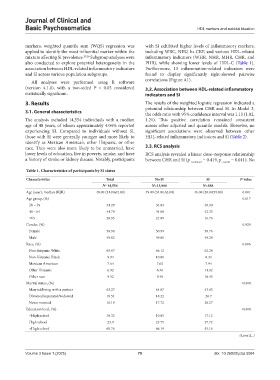
markers, weighted quantile sum (WQS) regression was with SI exhibited higher levels of inflammatory markers,
applied to identify the most influential marker within the including WBC, NEU, hs-CRP, and various HDL-related
mixture affecting SI prevalence. 25,26 Subgroup analyses were inflammatory indicators (WHR, NHR, MHR, CHR, and
also conducted to explore potential heterogeneity in the PHR), while showing lower levels of HDL-C (Table 1).
association between HDL-related inflammatory indicators Furthermore, 13 inflammation-related indicators were
and SI across various population subgroups. found to display significantly right-skewed pairwise
All analyses were performed using R software correlations (Figure A1).
(version 4.1.0), with a two-sided P < 0.05 considered 3.2. Association between HDL-related inflammatory
statistically significant. indicators and SI
3. Results The results of the weighted logistic regression indicated a
potential relationship between CHR and SI. In Model 3,
3.1. General characteristics the odds ratio with 95% confidence interval was 1.11 (1.02,
The analysis included 14,554 individuals with a median 1.21). This positive correlation remained consistent
age of 48 years, of whom approximately 4.04% reported across other adjusted and quantile models. However, no
experiencing SI. Compared to individuals without SI, significant associations were observed between other
those with SI were generally younger and more likely to HDL-related inflammatory indicators and SI (Table 2).
identify as Mexican American, other Hispanic, or other
race. They were also more likely to be unmarried, have 3.3. RCS analysis
lower levels of education, live in poverty, smoke, and have RCS analysis revealed a linear dose–response relationship
a history of stroke or kidney disease. Notably, participants between CHR and SI (p nonlinear = 0.419, p overall = 0.011). No
Table 1. Characteristics of participants by SI status
Characteristics Total No SI SI P-value
N=14,554 N=13,966 N=588
Age (year), median (IQR) 48.00 (34.00,62.00) 49.00 (34.00,62.00) 46.00 (30.00,59.00) 0.001
Age group, (%) 0.017
20 – 39 34.29 34.03 40.90
40 – 64 44.79 44.88 42.33
≥65 20.93 21.09 16.76
Gender, (%) 0.929
Female 50.98 50.99 50.76
Male 49.02 49.01 49.24
Race, (%) 0.006
Non-Hispanic White 65.97 66.12 62.24
Non-Hispanic Black 9.94 10.01 8.34
Mexican American 7.64 7.63 7.94
Other Hispanic 6.92 6.76 11.02
Other race 9.52 9.49 10.45
Marital status, (%) <0.001
Married/living with a partner 63.27 64.07 43.03
Divorced/separated/widowed 18.54 18.22 26.7
Never married 18.19 17.72 30.27
Education level, (%) <0.001
<High school 10.32 10.05 17.12
High school 23.9 23.75 27.72
>High school 65.78 66.19 55.16
(Cont'd...)
Volume 3 Issue 1 (2025) 79 doi: 10.36922/jcbp.5084