
Page 87 - JCBP-3-1
P. 87
Journal of Clinical and
Basic Psychosomatics HDL markers and suicidal ideation
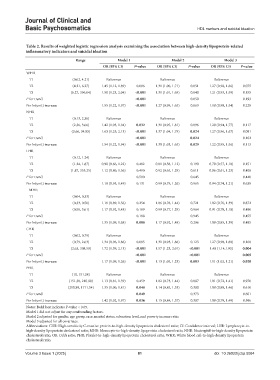
Table 2. Results of weighted logistic regression analysis examining the association between high-density lipoprotein-related
inflammatory indicators and suicidal ideation
Range Model 1 Model 2 Model 3
OR (95% CI) P-value OR (95% CI) P-value OR (95% CI) P-value
WHR
T1 (0.62, 4.21) Reference Reference Reference
T2 (4.21, 6.27) 1.45 (1.12, 1.89) 0.006 1.31 (1.00, 1.71) 0.051 1.27 (0.98, 1.66) 0.075
T3 (6.27, 396.04) 1.58 (1.23, 2.04) <0.001 1.31 (1.01, 1.69) 0.040 1.21 (0.93, 1.59) 0.155
P for trend <0.001 0.050 0.193
Per ln(unit) increase 1.55 (1.22, 1.97) <0.001 1.27 (0.99, 1.65) 0.063 1.18 (0.90, 1.54) 0.229
NHR
T1 (0.13, 2.36) Reference Reference Reference
T2 (2.36, 3.66) 1.42 (1.03, 1.94) 0.032 1.31 (0.95, 1.81) 0.096 1.29 (0.94, 1.77) 0.117
T3 (3.66, 34.85) 1.63 (1.25, 2.13) <0.001 1.37 (1.04, 1.79) 0.024 1.27 (0.96, 1.67) 0.091
P for trend <0.001 0.024 0.102
Per ln(unit) increase 1.54 (1.22, 1.94) <0.001 1.30 (1.03, 1.65) 0.029 1.22 (0.95, 1.56) 0.113
LHR
T1 (0.12, 1.24) Reference Reference Reference
T2 (1.24, 1.87) 0.90 (0.66, 1.22) 0.482 0.81 (0.58, 1.12) 0.190 0.79 (0.57, 1.10) 0.151
T3 (1.87, 355.25) 1.12 (0.80, 1.56) 0.490 0.92 (0.65, 1.29) 0.611 0.86 (0.61, 1.23) 0.408
P for trend 0.500 0.645 0.440
Per ln(unit) increase 1.19 (0.95, 1.49) 0.131 0.99 (0.79, 1.26) 0.965 0.94 (0.74, 1.21) 0.639
MHR
T1 (0.04, 0.33) Reference Reference Reference
T2 (0.33, 0.50) 1.18 (0.89, 1.56) 0.254 1.06 (0.78, 1.44) 0.721 1.02 (0.76, 1.39) 0.872
T3 (0.50, 3.61) 1.17 (0.92, 1.48) 0.189 0.99 (0.77, 1.29) 0.964 0.91 (0.70, 1.18) 0.480
P for trend 0.188 0.945 0.455
Per ln(unit) increase 1.35 (1.09, 1.68) 0.008 1.17 (0.92, 1.48) 0.206 1.09 (0.85, 1.39) 0.485
CHR
T1 (0.02, 0.79) Reference Reference Reference
T2 (0.79, 2.63) 1.34 (0.96, 1.86) 0.085 1.31 (0.93, 1.86) 0.123 1.27 (0.90, 1.80) 0.168
T3 (2.63, 308.58) 1.72 (1.39, 2.13) <0.001 1.57 (1.23, 2.01) <0.001 1.48 (1.14,1.93) 0.004
P for trend <0.001 <0.001 0.005
Per ln(unit) increase 1.17 (1.09, 1.26) <0.001 1.13 (1.05, 1.23) 0.003 1.11 (1.02, 1.21) 0.020
PHR
T1 (10, 151.38) Reference Reference Reference
T2 (151.38, 210.89) 1.13 (0.81, 1.59) 0.459 1.02 (0.73, 1.44) 0.887 1.01 (0.72, 1.41) 0.970
T3 (210.89, 1711.54) 1.35 (1.00, 1.81) 0.048 1.14 (0.85, 1.53) 0.380 1.08 (0.80, 1.46) 0.610
P for trend 0.049 0.373 0.601
Per ln(unit) increase 1.42 (1.02, 1.97) 0.036 1.15 (0.84, 1.57) 0.387 1.09 (0.79, 1.49) 0.596
Notes: Bold font indicates P-value < 0.05.
Model 1 did not adjust for any confounding factors.
Model 2 adjusted for gender, age group, race, marital status, education level, and poverty income ratio.
Model 3 adjusted for all covariates.
Abbreviations: CHR: High-sensitivity C-reactive protein-to-high-density lipoprotein cholesterol ratio; CI: Confidence interval; LHR: Lymphocyte-to-
high-density lipoprotein cholesterol ratio; MHR: Monocyte-to-high-density lipoprotein cholesterol ratio; NHR: Neutrophil-to-high-density lipoprotein
cholesterol ratio; OR: Odds ratio; PHR: Platelet-to-high-density lipoprotein cholesterol ratio; WHR: White blood cell-to-high-density lipoprotein
cholesterol ratio.
Volume 3 Issue 1 (2025) 81 doi: 10.36922/jcbp.5084