
Page 100 - JCTR-10-1
P. 100
96 Mardany et al. | Journal of Clinical and Translational Research 2024; 10(1): 93-98
higher in Class III malocclusion compared to Class I and II posture and head inclination [14,15]. The mean volume of the
malocclusions (P < 0.001; Table 2). pharyngeal, velopharynx, oropharynx, and glossopharynx and the
A significant difference in volume was observed in all pharyngeal mean area of the narrowest region airway in patients with skeletal
space pairs between the two malocclusions, except glossopharyngeal Class III malocclusion were significantly larger than in patients
volume in Class I versus II and Class I versus III. Furthermore, there with skeletal Class I and II malocclusions. Class III patients have
were no significant differences in the most constricted area between a more protruding mandible and the tongue is positioned more
classes I and II and between classes I and III (Table 3). anteriorly. These anatomical features consequently widen the
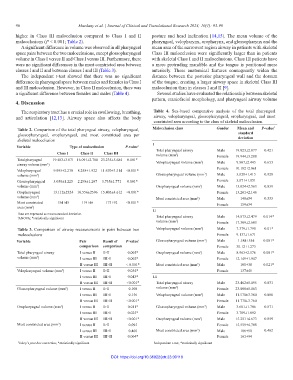
The independent t-test showed that there was no significant distance between the posterior pharyngeal wall and the dorsum
difference in pharyngeal space between males and females in Class I of the tongue, creating a larger airway space in skeletal Class III
and III malocclusion. However, in Class II malocclusion, there was malocclusion than in classes I and II [9].
a significant difference between females and males (Table 4). Several studies have evaluated the relationship between skeletal
pattern, craniofacial morphology, and pharyngeal airway volume
4. Discussion
The respiratory tract has a crucial role in swallowing, breathing, Table 4. Sex-based comparative analysis of the total pharyngeal
and articulation [12,13]. Airway space also affects the body airway, velopharyngeal, glossopharyngeal, oropharyngeal, and most
constricted area according to the class of skeletal malocclusion.
Table 2. Comparison of the total pharyngeal airway, velopharyngeal, Malocclusion class Gender Mean and P‑value ˦
glossopharyngeal, oropharyngeal, and most constricted area per standard
skeletal malocclusion deviation
Variable Type of malocclusion P‑value ˦ I Total pharyngeal airway Male 19.023±2.877 0.421
Class I Class II Class III volume (mm ) Female 19.944±3.288
3
Total pharyngeal 19.483±3.071 16.091±2.788 23.235±5.684 0.001* 3
airway volume (mm ) Velopharyngeal volume (mm ) Male 9.807±2.445 0.653
3
Velopharyngeal 9.995±2.230 8.258±1.922 11.670±3.514 <0.001* Female 10.182±2.061
3
volume (mm ) Glossopharyngeal volume (mm ) Male 3.029±1.415 0.928
3
Glossopharyngeal 3.050±1.225 2.298±1.207 3.735±1.771 0.001* Female 3.071±1.051
volume (mm ) Oropharyngeal volume (mm ) Male 13.024±2.563 0.839
3
3
Oropharyngeal 13.112±2324 10.556±2596 15.405±4.612 <0.001* Female 13.201±2.146
volume (mm ) Most constricted area (mm ) Male 148±54 0.533
3
2
Most constricted 154±45 119±46 173±92 <0.001* Female 159±34
area (mm )
2
II
Data are expressed as mean±standard deviation.
˦ ANOVA; *statistically significant Total pharyngeal airway Male 14.873±2.479 0.014*
volume (mm ) Female 17.309±2.603
3
3
Table 3. Comparison of airway measurements in pairs between two Velopharyngeal volume (mm ) Male 7.379±1.790 0.01*
malocclusions Female 9.137±1.671
3
Variable Pair Result of P‑value ˦ Glossopharyngeal volume (mm ) Male 1.584±554 0.001*
comparison comparison Female 30.12±1.273
Total pharyngeal airway I versus II I>II 0.005* Oropharyngeal volume (mm ) Male 8.963±2.176 0.001*
3
volume (mm ) I versus III III>I 0.002* Female 12.149±1.947
3
II versus III III>II < 0.001* Most constricted area (mm ) Male 100±38 0.021*
2
Velopharyngeal volume (mm ) I versus II I>II 0.034* Female 137±46
3
I versus III III>I 0.043* III
II versus III III>II <0.001* Total pharyngeal airway Male 23.462±5.695 0.831
3
Glossopharyngeal volume (mm ) I versus II I>II 0.108 volume (mm ) Female 23.008±5.863
3
I versus III III>I 0.156 Velopharyngeal volume (mm ) Male 11.570±3.380 0.880
3
II versus III III>II <0.001* Female 11.770±3.760
Oropharyngeal volume (mm ) I versus II I>II 0.011* Glossopharyngeal volume (mm ) Male 3.681±1.706 0.871
3
3
I versus III III>I 0.025* Female 3.789±1.892
II versus III III>II <0.001* Oropharyngeal volume (mm ) Male 15.251±4.673 0.859
3
Most constricted area (mm ) I versus II I>II 0.095 Female 15.559±4.708
2
I versus III III>I 0.460 Most constricted area (mm ) Male 186±90 0.462
2
II versus III III>II 0.004* Female 161±94
˦ Tukey’s post-hoc correction; *statistically significant ˦ Independent t-test; *statistically significant
DOI: https://doi.org/10.36922/jctr.23.00110