
Page 99 - JCTR-10-1
P. 99
Mardany et al. | Journal of Clinical and Translational Research 2024; 10(1): 93-98 95
2.2. Velopharyngeal airway volume (VP) 2.3. Glossopharyngeal airway volume (GP)
The upper bound of the velopharyngeal airway passes through The upper bound of the glossopharyngeal airway passes
PNS and is parallel to the standard horizontal plane; the lower through the tip at the end of the soft palate and is parallel to the
bound passes through the tip at the end of the soft palate and is standard horizontal plane; the lower bound passes through the
parallel to the standard horizontal plane. upper tip at the end of the epiglottis and is parallel to the standard
horizontal plane.
2.4. Oropharyngeal airway volume (OP)
VP + GP, the velopharyngeal and glossopharyngeal airways are
together known as the oropharyngeal airway.
2.5. Most constricted area
The smallest cross-sectional views of the upper respiratory
tract of the image were measured.
The data were analyzed using SPSS software version 22.0
(IBM, Armonk, NY, USA). Analysis of variance (ANOVA) and
Tukey’s post-hoc correction were used to compare the dimensions
of the airway among the skeletal malocclusion groups (Class I, II,
and III). P < 0.05 was considered statistically significant.
3. Results
This study analyzed CBCT images of 90 patients (45 males and
45 females) aged 17 – 39 years. The three groups did not have
any significant difference in terms of gender and age. All data
were normally distributed. According to ANOVA results, there
was a significant difference in the means of SNA, SNB, and ANB
angles and Wits appraisal among the three malocclusion classes.
However, the mean GoGn-SN angle did not show any significant
difference among the three classes (Table 1).
The total pharyngeal airway volume was 19.483 ± 3.071,
16.091 ± 2.788, and 23.235 ± 5.684 mm in Class I, II, and III
3
malocclusions, respectively (P < 0.001). The volume of the
total pharyngeal airway, velopharyngeal, glossopharyngeal,
and oropharyngeal and the most constricted area in Class II
malocclusion were less than Class I and III malocclusions
(P < 0.001). The volume of velopharyngeal, glossopharyngeal,
and oropharyngeal regions and the most constricted area were
Table 1. Comparison of cephalometric measurements according to the
skeletal malocclusion
Variable Type of malocclusion P‑value ˦
Class I Class II Class III
SNA 2 81.8±1.9 81.5±2.0 79.8±2.2 0.005*
SNB 2 79.3±2.1 76.1±2.8 81.5±2.2 <0.001*
ANB 2 2.6±1.0 5.9±1.7 −1.8±1.4 <0.001 *
Wits −3.0±0.3 4.0±2.3 −4.2±2.1 <0.001*
Sn-Go-Gn 2 32.7±2.7 32.3±2.5 32.6±2.4 0.845
Data are expressed as mean±standard deviation.
˦ ANOVA; *statistically significant.
2 S, the center of the sella turcica; N, the intersection points of the nasion and the frontal
bone in the sagittal view; A, the innermost point on the anterior contour of the maxilla
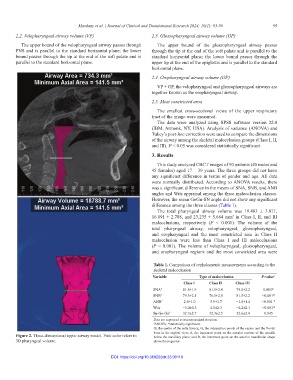
Figure 2. Three-dimensional upper airway model. Pink color refers to below the maxillary plane; and B, the innermost point on the anterior mandibular shape
3D pharyngeal volume. above the pogonion
DOI: https://doi.org/10.36922/jctr.23.00110