
Page 40 - JCTR-10-1
P. 40
36 Gonda et al. | Journal of Clinical and Translational Research 2024; 10(1): 33-51
significantly decreased (P < 0.05). D-dimer decreased significantly The IgA level at admission in the uninfected group was
on day 14 after admission (P < 0.05), and CRP was significantly significantly higher than the IgA level on day 5 in both the
elevated (P < 0.05). molnupiravir alone group and the molnupiravir plus CAM group
In the molnupiravir plus CAM group, there were no significant (P < 0.05).
differences in any of the biomarkers between admission and day 5. The sIL2R level at admission in the uninfected group was
In addition, the values of D-dimer decreased significantly on day significantly lower than the sIL2R level on day 5 in both the
14 after admission (P < 0.05). molnupiravir alone group and the molnupiravir plus CAM group
In the uninfected group, no significant differences in biomarkers (P < 0.05).
were observed before infection, on day 5, and on day 14. The In the molnupiravir plus CAM group, the IgA level on day 14
values of biomarkers, except for BNP, were within normal limits was significantly higher than that on day 5, and the sIL2R level
(Figure 2 and Supplementary Data 2). on day 14 was significantly lower than that on day 5 (P < 0.05).
In the molnupiravir plus CAM group, the IgA level on day
3.3. Dynamics of IgG, IgA, IgM, and sIl2R in advanced stages 14 was significantly higher (P < 0.05) and the sIL2R level was
of disease in molnupiravir alone group, molnupiravir plus significantly lower (P < 0.05) than in the molnupiravir alone
clarithromycin group, and uninfected group
group. The values of IgG and IgM were within the normal limit.
We measured baseline levels of immunological biomarkers on 3.4. Predictive factors as blood biomarker in molnupiravir alone
days 5 and 14 from the start of oral administration at the time of group and molnupiravir plus clarithromycin group
infection in the molnupiravir alone group and the molnupiravir
plus CAM group and on the day of admission in the uninfected Multivariate logistic regression analysis based on the
group (Figure 3 and Supplementary Data 3). collection and analysis of clinical and laboratory data for the
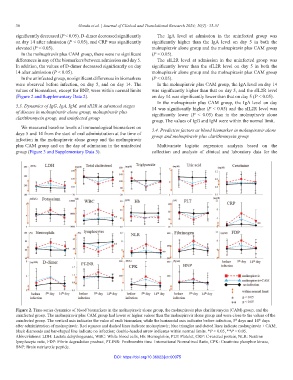
Figure 2. Time-series dynamics of blood biomarkers in the molnupiravir alone group, the molnupiravir plus clarithromycin (CAM) group, and the
uninfected group. The molnupiravir plus CAM group had lower or higher values than the molnupiravir alone group and were close to the values of the
uninfected group. The vertical axis indicates the value of each biomarker, while the horizontal axis indicates before infection, 5 days and 14 days
th
th
after administration of molnupiravir. Red squares and dashed lines indicate molnupiravir; blue triangles and dotted lines indicate molnupiravir + CAM;
black diamonds and bar-shaped line indicate no infection; double-headed arrow indicates within normal limits. *P < 0.05, **P < 0.05.
Abbreviations: LDH: Lactate dehydrogenase, WBC: White blood cells, Hb: Hemoglobin, PLT: Platelet, CRP: C-reacted protein, NLR: Neutron–
lymphocyte ratio, FDP: Fibrin degradation product, PT-INR: Prothrombin time–International Normalized Ratio, CPK: Creatinine phosphor kinase,
BNP: Brain natriuretic peptide.
DOI: https://doi.org/10.36922/jctr.00075