
Page 11 - JCTR-10-4
P. 11
Tyson et al. | Journal of Clinical and Translational Research 2024; 10(4): 229-236 233
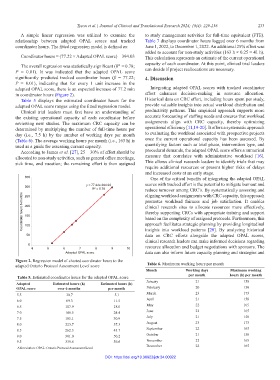
A simple linear regression was utilized to examine the to study management activities for full-time equivalent (FTE).
relationship between adapted OPAL scores and tracked Table 7 displays coordinator hours logged over 6 months from
coordinator hours. The fitted regression model is defined as: June 1, 2022, to December 1, 2022. An additional 25% effort was
added to account for non-study activities (163 h × 0.25 = 41 h).
Coordinator hours = (77.22 × Adapted OPAL score) – 394.03 This calculation represents an estimate of the current operational
The overall regression was statistically significant (R = 0.78; capacity of each coordinator. At this point, clinical trial leaders
2
P = 0.01). It was indicated that the adapted OPAL score can decide if project reallocations are necessary.
significantly predicted tracked coordinator hours (β = 77.22; 4. Discussion
P = 0.01), indicating that for every 1 unit increase in the
adapted OPAL score, there is an expected increase of 77.2 min Integrating adapted OPAL scores with tracked coordinator
in coordinator hours (Figure 2). effort enhances decision-making in resource allocation.
Table 5 displays the estimated coordinator hours for the Historical data on CRC effort, including hours spent per study,
adapted OPAL score ranges using the fitted regression model. provide valuable insights into actual workload distribution and
Clinical trial leaders must first have an understanding of productivity patterns. This empirical approach supports more
the existing operational capacity of each coordinator before accurate forecasting of staffing needs and ensures that workload
reviewing new studies. The maximum CRC capacity can be assignments align with CRC capacity, thereby optimizing
determined by multiplying the number of full-time hours per operational efficiency [11,19-20]. It offers a systematic approach
day (i.e., 7.5 h) by the number of working days per month to evaluating the workload associated with prospective projects
(Table 6). The average working hours per month (i.e., 163 h) is once the current operational capacity has been assessed. By
used as a guide for assessing current capacity. quantifying factors such as trial phase, intervention type, and
According to James et al. [27], 25 – 30% of effort should be procedural demands, the adapted OPAL score offers a numerical
allocated to non-study activities, such as general office meetings, measure that correlates with administrative workload [16].
sick time, and vacation; the remaining effort is then assigned This allows clinical research leaders to identify trials that may
require additional resources or present higher risks of delays
and increased costs at an early stage.
350 One of the critical benefits of integrating the adapted OPAL
300 y = 77.22x-394.03 scores with tracked effort is the potential to mitigate burnout and
R² = 0.78 reduce turnover among CRC’s. By systematically assessing and
aligning workload assignments with CRC capacity, this approach
Coordinator hours 6-months 200 promotes workload fairness and job satisfaction. It enables
250
clinical research sites to allocate resources more effectively,
thereby supporting CRCs with appropriate training and support
150
based on the complexity of assigned protocols. Furthermore, this
100
insights into workload patterns [20]. By analyzing historical
data on CRC efforts alongside the adapted OPAL scores,
50 approach facilitates strategic planning by providing longitudinal
clinical research leaders can make informed decisions regarding
0 resource allocation and budget negotiations with sponsors. The
4 5 6 7 8 9 10
Adapted OPAL score data can also inform future capacity planning and strategies and
Figure 2. Regression model of charted coordinator hours to the
adapted Ontario Protocol Assessment Level score Table 6. Maximum working hours per month
Month Working days Maximum working
Table 5. Estimated coordinator hours for the adapted OPAL score per month hours (h) per month
Adapted Estimated hours (h) Estimated hours (h) January 21 158
OPAL score over 6 months per month February 20 150
5.5 30.7 5.1 March 23 173
6.0 69.3 11.5 April 21 158
6.5 107.9 18.0 May 22 165
7.0 146.5 24.4 June 22 165
7.5 185.1 30.9 July 21 158
8.0 223.7 37.3 August 23 173
8.5 262.3 43.7 September 22 165
9.0 301.0 50.2 October 21 158
9.5 339.6 56.6 November 22 165
December 22 165
Abbreviation: OPAL: Ontario Protocol Assessment Level
DOI: https://doi.org/10.36922/jctr.24.00022