
Page 26 - JCTR-10-4
P. 26
248 Sari et al. | Journal of Clinical and Translational Research 2024; 10(4): 246-255
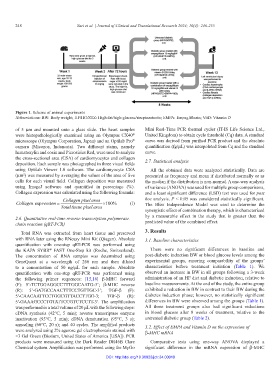
Figure 1. Scheme of animal experiments
Abbreviations: BW: Body weight; HF/HG/STZ: High-fat/high-glucose/streptozotocin; EMPA: Empagliflozin; VitD: Vitamin D
of 5 µm and mounted onto a glass slide. The heart samples Mini Real-Time PCR thermal cycler (IT-IS Life Science Ltd.,
were histopathologically examined using an Olympus CX40 United Kingdom) to obtain cycle threshold (Cq) data. A standard
®
microscope (Olympus Corporation, Japan) and an Optilab Pro curve was derived from purified PCR product and the absolute
®
camera (Miconos, Indonesia). Two different stains, namely quantification (fg/µL) was interpolated from Cq and the standard
hematoxylin and eosin and Picrosirius Red, were used to analyze curve.
the cross-sectional area (CSA) of cardiomyocytes and collagen
deposition. Each sample was photographed in three visual fields 2.7. Statistical analysis
using Optilab Viewer 1.0 software. The cardiomyocyte CSA All the obtained data were analyzed statistically. Data are
(µm ) was measured by averaging the values of the area of five presented as frequency and mean if distributed normally or as
2
cells for each visual field. Collagen deposition was measured the median if the distribution is non-normal. A one-way analysis
using ImageJ software and quantified in percentage (%). of variance (ANOVA) was used for multiple group comparisons,
Collagen expression was calculated using the following formula: and a least significant difference (LSD) test was used for post
Collagen pixel area hoc analysis. P < 0.05 was considered statistically significant.
Collagen expression = × 100% (I) The Bliss Independence Model was used to determine the
Totaltissue pixel area
synergistic effect of combination therapy, which is characterized
2.6. Quantitative real-time reverse-transcription polymerase by a measurable effect in the study that is greater than the
chain reaction (qRT-PCR) predicted value of the combined effect.
Total RNA was extracted from heart tissue and preserved 3. Results
with RNA later using the RNeasy Mini Kit (Qiagen). Absolute 3.1. Baseline characteristics
quantification with one-step qRT-PCR was performed using
the KAPA SYBR FAST One-Step kit (Roche, Switzerland). There were no significant differences in baseline and
®
The concentration of RNA samples was determined using post-diabetic induction BW or blood glucose levels among the
GeneQuant at a wavelength of 260 nm and then diluted experimental groups, ensuring comparability of the groups’
to a concentration of 50 ng/µL for each sample. Absolute characteristics before treatment initiation (Table 1). We
quantification with one-step qRT-PCR was performed using observed an increase in BW in all groups following a 3-week
the following primer sequences: [15,16] β-MHC forward administration of an HF diet and diabetic induction, relative to
(F): 5’-TCTGGAGGCCTTTGGCAATG-3’; β-MHC reverse baseline measurements. At the end of the study, the entire group
(R): 5’-GATGCCAACTTTCCTGTTGC-3’; TGF-β (F): exhibited a reduction in BW in contrast to their BW during the
5′-CAACAATTCCTGGCGTTACCTTGG-3; TGF-β (R): diabetes induction phase; however, no statistically significant
5′-GAAAGCCCTGTATTCCGTCTCCTT-3′. The amplification differences in BW were observed among the groups (Table 1).
was performed in a total volume of 20 µL with the following steps: All three treatment groups also had significant reductions
cDNA synthesis (42°C, 5 min); reverse transcriptase enzyme in blood glucose after 8 weeks of treatment, relative to the
inactivation (95°C, 5 min); cDNA denaturation (95°C, 3 s); untreated diabetic group (Table 2).
annealing (60°C, 20 s); and 40 cycles. The amplified products 3.2. Effect of EMPA and Vitamin D on the expression of
were analyzed using 2% agarose gel electrophoresis stained with β-MHC mRNA
×3 Gel Green (Biotium, United States of America [USA]). PCR
products were measured using the Dark Reader DR46B Clare Comparative tests using one-way ANOVA displayed a
Chemical system. Amplification was performed using the MyGo significant difference in the mRNA expression of β-MHC
DOI: http://doi.org/10.36922/jctr.24.00010