
Page 28 - JCTR-10-4
P. 28
250 Sari et al. | Journal of Clinical and Translational Research 2024; 10(4): 246-255
95% CI: 1.09 – 28.66; P = 0.048), Vitamin D (mean difference:
26.69 fg/µL; 95% CI: 11.82 – 41.57; P = 0.001), and combination
therapy (mean difference: 43.43 fg/µL; 95% CI: 28.03 – 58.83;
P < 0.001) compared to the untreated diabetic group (Figure 7).
The HF/HG/STZ+VitD group tended to express lower levels
of TGF-β mRNA compared to the HF/HG/STZ+EMPA
group, though not statistically significant (mean difference:
12.91 fg/µL; 95% CI: −1.96 – 27.79; P = 0.086). Compared
to monotherapy, combination therapy displayed the greatest
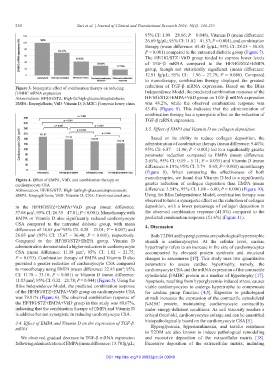
Figure 3. Synergistic effect of combination therapy on reducing reduction of TGF-β mRNA expression. Based on the Bliss
β-MHC mRNA expression Independence Model, the predicted combination response of the
Abbreviations: HF/HG/STZ: High-fat/high-glucose/streptozotocin; HF/HG/STZ+EMPA+VitD group on TGF-β mRNA expression
EMPA: Empagliflozin; VitD: Vitamin D; β-MHC: β-myosin heavy chain was 48.2%, while the observed combination response was
43.4% (Figure 8). This indicates that the administration of
combination therapy has a synergistic effect on the reduction of
TGF-β mRNA expression.
3.5. Effect of EMPA and Vitamin D on collagen deposition
Based on its ability to reduce collagen deposition, the
administration of combination therapy (mean difference: 9.41%;
95% CI: 6.87 – 11.96; P < 0.001) led to a significantly greater
parameter reduction compared to EMPA (mean difference:
2.65%; 95% CI: 0.19 – 5.11; P = 0.035) and Vitamin D (mean
difference: 6.19%; 95% CI: 3.74 – 8.65; P < 0.001) monotherapy
(Figure 9). When comparing the effectiveness of both
Figure 4. Effect of EMPA, VitD, and combination therapy on monotherapies, we found that Vitamin D led to a significantly
cardiomyocyte CSA greater reduction of collagen deposition than EMPA (mean
Abbreviation: HF/HG/STZ: High-fat/high-glucose/streptozotocin; difference: 3.54%; 95% CI: 1.08 – 6.00; P = 0.006) (Figure 10).
EMPA: Empagliflozin; VitD: Vitamin D; CSA: Cross-sectional area Using the Bliss Independence Model, combination therapy was
observed to have a synergistic effect on the reduction of collagen
in the HF/HG/STZ+EMPA+VitD group (mean difference: deposition, with a lower percentage of collagen deposition in
37.08 µm ; 95% CI: 26.35 – 47.81; P < 0.001). Monotherapy with the observed combination response (41.8%) compared to the
2
EMPA or Vitamin D also significantly reduced cardiomyocyte predicted combination response (51.6%) (Figure 11).
CSA compared to the untreated diabetic group, with mean 4. Discussion
differences of 14.65 µm 95% CI: 4.28 – 25.01; P = 0.007) and
2 (
26.03 µm (95% CI: 15.67 – 36.40; P < 0.001), respectively. Both T2DM and hyperglycemia are pathological hypertrophic
2
Compared to the HF/HG/STZ+EMPA group, Vitamin D stimuli in cardiomyocytes. At the cellular level, cardiac
administration demonstrated a higher reduction in cardiomyocyte hypertrophy refers to an increase in the size of cardiomyocytes
CSA (mean difference: 11.38 µm ; 95% CI: 1.02 – 21.75; accompanied by elevated protein synthesis and structural
2
P = 0.033). Combination therapy of EMPA and Vitamin D also changes in sarcomeres [17]. This study uses two quantitative
provided a greater reduction of cardiomyocyte CSA compared parameters to assess cardiac hypertrophy, namely, the
to monotherapy using EMPA (mean difference: 22.43 µm ; 95% cardiomyocyte CSA and the mRNA expression of the contractile
2
CI: 11.70 – 33.16; P < 0.001) or Vitamin D (mean difference: cytoskeletal β-MHC protein as a marker of hypertrophy [17].
11.05 µm ; 95% CI: 0.32 – 21.78; P = 0.044) (Figure 5). Using the Apoptosis, resulting from hyperglycemia-induced stress, causes
2
Bliss Independence Model, the predicted combination response viable cardiomyocytes to undergo hypertrophy to compensate
of the HF/HG/STZ+EMPA+VitD group on cardiomyocyte CSA for cardiac pump function [4,5]. Exposure to pathological
was 79.81% (Figure 6). The observed combination response of stimuli increases the expression of the contractile cytoskeletal
the HF/HG/STZ+EMPA+VitD group in this study was 80.67%, β-MHC protein, maintaining cardiomyocyte contractility
indicating that the combination therapy of EMPA and Vitamin D under energy-deficient conditions. As cell viscosity reaches a
is additive but not synergistic in reducing cardiomyocyte CSA. critical threshold, cardiomyocytes enlarge and can be quantified
3.4. Effect of EMPA and Vitamin D on the expression of TGF-β histopathologically based on the cardiomyocyte CSA [5].
mRNA Hyperglycemia, hyperinsulinemia, and insulin resistance
in T2DM are also known to induce pathological remodeling
We observed gradual decrease in TGF-β mRNA expression and excessive deposition of the extracellular matrix [18].
following administration of EMPA (mean difference: 13.78 fg/µL; Excessive deposition of the extracellular matrix, including
DOI: http://doi.org/10.36922/jctr.24.00010