
Page 27 - JCTR-10-4
P. 27
Sari et al. | Journal of Clinical and Translational Research 2024; 10(4): 246-255 249
Table 1. Characteristics of the experimental groups at baseline, following diabetic induction, and post-treatment administration
Characteristic Experimental groups P a
HF/HG/STZ HF/HG/STZ+EMPA HF/HG/STZ+VitD HF/HG/STZ+EMPA+VitD
Weight (g)
Baseline 159.37±22.58 162.50±30.58 155.62±31.67 151.42±11.07 0.854
Post-diabetic induction 187.37±26.74 203.25±32.99 189.00±23.73 179.00±18.40 0.358
Post-treatment 183.00±21.43 169.37±13.90 173.62±33.29 158.71±33.29 0.250
Fasting blood glucose (mg/dL)
Baseline 110.00±7.69 115.00±8.00 109.37±6.47 110.00±4.32 0.343
Post-diabetic induction 422.12±180.79 524.37±109.26 437.25±206.71 390.00±54.09 0.370
Post-treatment 376.12±117.66 150.87±29.29 160.25±56.77 147.42±60.73 <0.001*
Note: P-values were obtained using one-way analysis of variance to compare the differences in mean among groups; *P<0.05.
a
Abbreviations: HF/HG/STZ: High-fat/high-glucose/streptozotocin; EMPA: Empagliflozin; VitD: Vitamin D.
Table 2. Post-hoc analyses of fasting blood glucose levels between experimental groups
Group Difference in blood glucose levels, mean±SD (mg/dL)
HF/HG/STZ HF/HG/STZ+EMPA HF/HG/STZ+VitD HF/HG/STZ+EMPA+VitD
HF/HG/STZ - 225.25±36.97 215.87±36.97 228.69±38.26
(P<0.001) (P<0.001) (P<0.001)
HF/HG/STZ+EMPA −225.25±36.97 - −9.37±36.97 3.44±38.26
(P<0.001) (P=0.802) (P=0.929)
HF/HG/STZ+VitD −215.87±36.97 9.37±36.97 - 12.82±38.26
(P<0.001) (P=0.802) (P=0.740)
HF/HG/STZ+EMPA+VitD −228.69±38.26 −3.44±38.26 −12.82±38.26 -
(P<0.001) (P=0.929) (P=0.740)
Abbreviations: HF/HG/STZ: High-fat/high-glucose/streptozotocin; EMPA: Empagliflozin; VitD: Vitamin D.
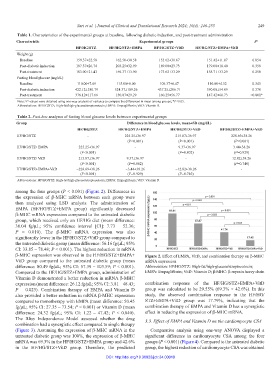
among the four groups (P < 0.001) (Figure 2). Differences in
the expression of β-MHC mRNA between each group were
then analyzed using LSD analysis. The administration of
EMPA (HF/HG/STZ+EMPA group) significantly decreased
β-MHC mRNA expression compared to the untreated diabetic
group, which received only an HF/HG diet (mean difference:
30.04 fg/µL; 95% confidence interval [CI]: 7.73 – 52.36;
P = 0.010). The β-MHC mRNA expression was also
significantly lower in the HF/HG/STZ+VitD group compared to
the untreated diabetic group (mean difference: 56.16 fg/µL; 95%
CI: 33.85 – 78.48; P < 0.001). The highest reduction in mRNA
β-MHC expression was observed in the HF/HG/STZ+EMPA+ Figure 2. Effect of EMPA, VitD, and combination therapy on β-MHC
VitD group compared to the untreated diabetic group (mean mRNA expression
difference: 80.49 fg/µL; 95% CI: 57.39 – 103.59; P < 0.001). Abbreviation: HF/HG/STZ: High-fat/high-glucose/streptozotocin;
Compared to the HF/HG/STZ+EMPA group, administration of EMPA: Empagliflozin; VitD: Vitamin D; β-MHC: β-myosin heavy chain
Vitamin D demonstrated a better reduction in mRNA β-MHC
expression (mean difference: 26.12 fg/µL; 95% CI: 3.81 – 48.43; combination response of the HF/HG/STZ+EMPA+VitD
P = 0.023). Combination therapy of EMPA and Vitamin D group was calculated to be 29.55% (69.3% × 42.6%). In this
also provided a better reduction in mRNA β-MHC expression study, the observed combination response in the HF/HG/
compared to monotherapy with EMPA (mean difference: 50.45 STZ+EMPA+VitD group was 17.79%, indicating that the
fg/µL; 95% CI: 27.35 – 73.54; P < 0.001) or Vitamin D (mean combination therapy of EMPA and Vitamin D has a synergistic
difference: 24.32 fg/µL; 95% CI: 1.22 – 47.42; P < 0.040). effect in reducing the expression of β-MHC mRNA.
The Bliss Independence Model assessed whether the drug 3.3. Effect of EMPA and Vitamin D on the cardiomyocyte CSA
combination had a synergistic effect compared to single therapy
(Figure 3). Assuming the expression of β-MHC mRNA in the Comparative analysis using one-way ANOVA displayed a
untreated diabetic group was 100%, the expression of β-MHC significant difference in cardiomyocyte CSA among the four
mRNA was 69.3% in the HF/HG/STZ+EMPA group and 42.6% groups (P < 0.001) (Figure 4). Compared to the untreated diabetic
in the HF/HG/STZ+VitD group. Therefore, the predicted group, the highest reduction of cardiomyocyte CSA was obtained
DOI: http://doi.org/10.36922/jctr.24.00010