
Page 19 - JCTR-10-6
P. 19
Barreto et al. | Journal of Clinical and Translational Research 2024; 10(6): 325-333 329
A B C
D
F E
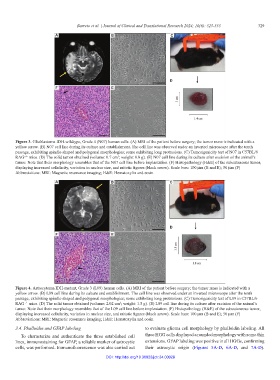
Figure 3. Glioblastoma IDH-wildtype, Grade 4 (N07) human cells. (A) MRI of the patient before surgery; the tumor mass is indicated with a
yellow arrow. (B) N07 cell line during its culture and establishment. The cell line was observed under an inverted microscope after the tenth
passage, exhibiting spindle-shaped and polygonal morphologies; some exhibiting long protrusions. (C) Tumorigenicity test of N07 in C57BL/6
RAG mice. (D) The solid tumor obtained (volume: 0.7 cm ; weight: 0.8 g). (E) N07 cell line during its culture after excision of the animal’s
−/−
3
tumor. Note that their morphology resembles that of the N07 cell line before implantation. (F) Histopathology (H&E) of the subcutaneous tumor,
displaying increased cellularity, variation in nuclear size, and mitotic figures (black arrow). Scale bars: 100 µm (B and E); 50 µm (F)
Abbreviations: MRI: Magnetic resonance imaging; H&E: Hematoxylin and eosin
A B C
D
F E
Figure 4. Astrocytoma IDH-mutant, Grade 3 (L09) human cells. (A) MRI of the patient before surgery; the tumor mass is indicated with a
yellow arrow. (B) L09 cell line during its culture and establishment. The cell line was observed under an inverted microscope after the tenth
passage, exhibiting spindle-shaped and polygonal morphologies; some exhibiting long protrusions. (C) Tumorigenicity test of L09 in C57BL/6
RAG mice. (D) The solid tumor obtained (volume: 2.02 cm ; weight: 1.5 g). (E) L09 cell line during its culture after excision of the animal’s
−/−
3
tumor. Note that their morphology resembles that of the L09 cell line before implantation. (F) Histopathology (H&E) of the subcutaneous tumor,
displaying increased cellularity, variation in nuclear size, and mitotic figures (black arrow). Scale bars: 100 µm (B and E); 50 µm (F)
Abbreviations: MRI: Magnetic resonance imaging; H&E: Hematoxylin and eosin
3.4. Phalloidin and GFAP labeling to evaluate glioma cell morphology by phalloidin labeling. All
To characterize and authenticate the three established cell three HGG cells displayed a rounded morphology with some thin
lines, immunostaining for GFAP, a reliable marker of astrocytic extensions. GFAP labeling was positive in all HGGs, confirming
cells, was performed. Immunofluorescence was also carried out their astrocytic origin (Figures 5A-D, 6A-D, and 7A-D).
DOI: http://doi.org/10.36922/jctr.24.00028