
Page 35 - JCTR-10-6
P. 35
Musawi et al. | Journal of Clinical and Translational Research 2024; 10(6): 343-347 345
steps for LAP II pattern preparation. They were taught how to total BOT-2 score or total BOT-2 subtest scores. Analyses were
prepare a flat pulpal floor, produce a proper outline form, achieve performed using SAS version 9.4 (SAS Inc., USA). A P < 0.05
a proper cavity wall angulation outline for the preparation, reach was considered statistically significant.
the ideal pulpal depth and smoothness, and use a perio probe to
measure the height of the walls. 3. Results
Students then practiced preparing a specific LAP II pattern A total of 42 dental students (22 males and 20 females) from
under direct faculty supervision. This practice exercise was the D1 class of 2017 participated in this study; one female
designed for students to familiarize themselves with the student was excluded due to her inability to perform some of
handpiece and LAP II preparation. The supervising faculty did the BOT-2 tasks required for the study. The mean age of the
not provide feedback on the preparation quality but did provide students was 24 years old. Using the general linear model,
feedback about the proper use of the simulation unit, handpiece, which is a mixture of both regression and analysis of variance, a
and bur. During the activity, dental handpieces were preset to correlation was found between the total BOT-2 scores and LAP
the same settings and speed (20000 rpm) for all students, and II cavity preparation performance (Figure 2).
all students used the same bur (330 Carbide). A faculty member, Student scores on the BOT-2 are presented in Table 1. For
who was experienced with the standardized parameters of the the fine motor precision subtest, only drawing lines through a
LAP II, administered and scored the activity. path (curved; median [IQR]: 7 [1]) and connecting dots (median
The BOT-2 and LAP II tests were administered to 1 -year [IQR]: 7 [0]) were significant (both P < 0.001). For the fine
st
students during orientation. Both tests were introduced to motor integration subtest, only copying overlapping circles
students as “a fun activity.” Student results for BOT2 were (median [IQR]: 5 [1]; P = 0.03) was significant. For the manual
calculated as a total score and as separate total scores for each dexterity subtest, only the total score was significantly different
subtest. Student scores for LAP II performance were categorized (median [IQR]: 34 [3]; P = 0.007).
as excellent (when the preparation was perfect or had one For LAP II, 17 students had excellent scores, 16 had
minor deviation from ideal), moderate (when the preparation moderate scores, and nine had poor scores. Comparisons
had only one moderate error or multiple minor deviations between the BOT-2 subtest scores and the LAP II scoring
from ideal), or poor (when the preparation had a major error or categories are presented in Table 2. A mean difference in total
multiple moderate errors, resembling a clinically unacceptable scores was found only for the BOT-2 manual dexterity subtest
performance). A single, blinded faculty member graded the (P = 0.01). Using the Tukey test adjustment, a difference was
work of all students using a simplified rubric. found between students with excellent and poor scores (mean
Overall BOT-2 scores were calculated using the median and difference [95% CI]: 3.5 [0.7 – 6.2]; P = 0.01).
interquartile range (IQR). The Wilcoxon rank sum test was used
to compare the BOT-2 total score and the total score for each 4. Discussion
subtest. Analysis of variance was used to compare total BOT-2 The current study assessed the correlation between student
scores for each subtest with student performance category BOT-2 scores and cavity preparation performance on LAP II
scores on the LAP II. The Tukey test was used for post-hoc layered base plate blocks to determine whether these tests could
comparisons, and data were reported as the mean difference be used as a non-cognitive indicator of preclinical operative
with the associated 95% confidence interval (CI). A generalized dentistry performance during the dental school admissions
linear model was used to investigate the correlation between process. The mean age of the students was 24 years old, which
student performance on the LAP II preparation activity and their
Figure 2. General linear model results for the correlation between the
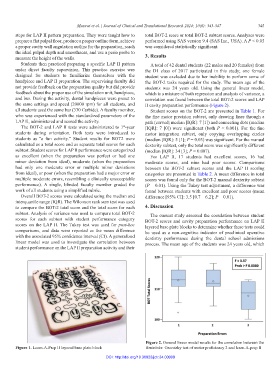
Figure 1. Learn-A-Prep II layered base plate block Bruininks–Oseretsky test of motor proficiency 2 and learn-A-prep II
DOI: http://doi.org/10.36922/jctr.24.00009