
Page 61 - JCTR-11-2
P. 61
Journal of Clinical and
Translational Research CT-guided needle versus glue localization
A B C
D E F G
H I J
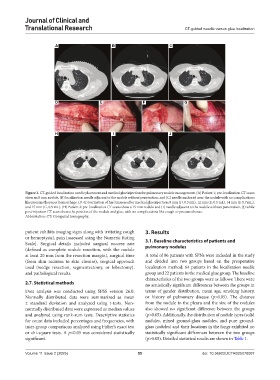
Figure 1. CT-guided localization needle placement and medical glue injection for pulmonary nodule management. (A) Patient 1; pre-localization CT scans
show an 8 mm nodule, (B) localization needle adjacent to the nodule without penetration, and (C) needle anchored near the nodule with no complications
like pneumothorax or hemorrhage. (D-G) Formation of hard masses after medical glue injection; 9 mm (D, 0.3 mL), 12 mm (E, 0.5 mL), 14 mm (F, 0.7 mL),
and 15 mm (G, 0.9 mL). (H) Patient 2; pre-localization CT scans show a 15 mm nodule and (I) needle adjacent to the nodule without penetration, (J) while
post-injection CT scan shows the position of the nodule and glue, with no complications like cough or pneumothorax.
Abbreviation: CT: Computed tomography.
patient exhibits imaging signs along with irritating cough 3. Results
or hemoptysis), pain [assessed using the Numeric Rating
Scale]. Surgical details included surgical success rate 3.1. Baseline characteristics of patients and
(defined as complete nodule resection, with the nodule pulmonary nodules
at least 20 mm from the resection margin), surgical time A total of 86 patients with SPNs were included in the study
(from skin incision to skin closure), surgical approach and divided into two groups based on the preoperative
used (wedge resection, segmentectomy, or lobectomy), localization method: 64 patients in the localization needle
and pathological results. group and 22 patients in the medical glue group. The baseline
characteristics of the two groups were as follows: There were
2.7. Statistical methods no statistically significant differences between the groups in
Data analysis was conducted using SPSS version 26.0. terms of gender distribution, mean age, smoking history,
Normally distributed data were summarized as mean or history of pulmonary disease (p>0.05). The distance
± standard deviation and analyzed using t-tests. Non- from the nodule to the pleura and the size of the nodules
normally distributed data were expressed as median values also showed no significant difference between the groups
and analyzed using rank-sum tests. Descriptive statistics (p>0.05). Additionally, the distribution of nodule types (solid
for count data included percentages and frequencies, with nodules, mixed ground-glass nodules, and pure ground-
inter-group comparisons analyzed using Fisher’s exact test glass nodules) and their locations in the lungs exhibited no
or chi-square tests. A p<0.05 was considered statistically statistically significant differences between the two groups
significant. (p>0.05). Detailed statistical results are shown in Table 1.
Volume 11 Issue 2 (2025) 55 doi: 10.36922/JCTR025070007