
Page 48 - JCTR-11-3
P. 48
Journal of Clinical and
Translational Research Greek propolis use in COVID-19: Trial protocol
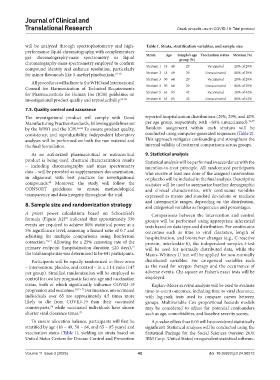
will be analyzed through spectrophotometry and high- Table 1. Strata, stratification variables, and sample size
performance liquid chromatography, with complementary
gas chromatography-mass spectrometry or liquid Strata Age Sample’s age Vaccination status Stratum (%)
group (%)
chromatography-mass spectrometry employed to confirm
compound identity and enhance resolution, particularly Stratum 1 18 – 49 29 Vaccinated 20% of 29%
for minor flavonoids like 3-methyl pinobanksin. 61-65 Stratum 2 18 – 49 29 Unvaccinated 80% of 29%
Stratum 3 50 – 64 29 Vaccinated 20% of 29%
All procedures will adhere to the WHO and International
Council for Harmonization of Technical Requirements Stratum 4 50 – 64 29 Unvaccinated 80% of 29%
for Pharmaceuticals for Human Use (ICH) guidelines on Stratum 5 65 – 85 42 Vaccinated 20% of 42%
investigational product quality and reproducibility. 66-68 Stratum 6 65 – 85 42 Unvaccinated 80% of 42%
7.3. Quality control and assurance
The investigational product will comply with Good reported hospitalization distributions (29%, 29%, and 42%
Manufacturing Practice standards, following guidelines set per age group, respectively, with ~80% unvaccinated). 76,77
by the WHO and the ICH. 66,68 To ensure product quality, Random assignment within each stratum will be
consistency, and reproducibility, independent laboratory conducted using computer-generated sequences (Table 2).
analyses will be performed on both the raw material and This approach mitigates confounding and strengthens the
the final formulation. internal validity of treatment comparisons across groups.
As no authorized pharmaceutical or nutraceutical 9. Statistical analysis
product is being used, chemical characterization results Statistical analysis will be performed in accordance with the
– including chromatography and mass spectrometry intention-to-treat principle. All randomized participants
data – will be provided as supplementary documentation, who receive at least one dose of the assigned intervention
in alignment with best practices for investigational or placebo will be included in the final analysis. Descriptive
compounds. Moreover, the study will follow the statistics will be used to summarize baseline demographic
68
CONSORT guidelines to ensure methodological and clinical characteristics, with continuous variables
transparency and data integrity throughout the trial. expressed as means and standard deviations or medians
8. Sample size and randomization strategy and interquartile ranges, depending on the distribution,
and categorical variables as frequencies and percentages.
A priori power calculations based on Schoenfeld’s Comparisons between the intervention and control
formula (Figure A2) indicated that approximately 330 groups will be performed using appropriate inferential
69
events are required to achieve 80% statistical power at a tests based on data type and distribution. For continuous
5% significance level, assuming a hazard ratio of 0.7 and outcomes such as time to viral clearance, length of
adjusting for multiple comparisons using Bonferroni hospitalization, and biomarker changes (e.g., C-reactive
correction. 70,71 Allowing for a 25% censoring rate of the protein, interleukin-6), the independent samples t-test
primary endpoint (hospitalization duration ≤20 days), will be used for normally distributed data, while the
72
the total sample size was determined to be 441 participants. Mann–Whitney U test will be applied for non-normally
Participants will be equally randomized to three arms distributed variables. For categorical variables such
– intervention, placebo, and control – in a 1:1:1 ratio (147 as the need for oxygen therapy and the occurrence of
per group). Stratified randomization will be employed to adverse events, Chi-square or Fisher’s exact tests will be
control for two key prognostic factors: age and vaccination employed.
status, both of which significantly influence COVID-19 Kaplan–Meier survival analysis will be used to evaluate
progression and outcomes. 38,73-75 For instance, unvaccinated time-to-event outcomes, including time to viral clearance,
individuals over 65 are approximately 4.5 times more with log-rank tests used to compare curves between
likely to die from COVID-19 than their vaccinated groups. Multivariable Cox proportional hazards models
counterparts, while vaccinated individuals have shown may be considered to adjust for potential confounders
74
shorter viral clearance times. 75 such as age, comorbidities, and baseline severity scores.
To ensure allocation balance, participants will first be A p-value of less than 0.05 will be considered statistically
stratified by age (18 – 49, 50 – 64, and 65 – 85 years) and significant. Statistical analyses will be conducted using the
vaccination status (Table 1), yielding six strata based on Statistical Package for the Social Sciences (version 26.0;
United States Centers for Disease Control and Prevention IBM Corp., United States) or equivalent statistical software.
Volume 11 Issue 3 (2025) 42 doi: 10.36922/jctr.24.00073