
Page 106 - JCTR-11-5
P. 106
Journal of Clinical and
Translational Research Uric acid, CTGF genotype, and prostate cancer
neither hyperuricemia (HR = 1.11, 95% CI: 0.82–1.51, 3.4. Association of hyperuricemia and uric acid
p=0.49) nor CTGF–CC genotype (HR = 1.11, 95% CI: levels with prostate cancer incidence stratified by
0.87–1.42, p=0.39) was significantly associated with CTGF genotypes
prostate cancer in the main effect models. However, the To illustrate the differing relationships between
“full model” showed that interaction effects between hyperuricemia, serum uric acid concentration, and
hyperuricemia and CTGF genotype were statistically prostate cancer risk according to CTGF genotype, we
significant in both the age-adjusted model (p=0.0082) conducted genotype-stratified analyses. Table 4 presents
and the fully adjusted model (p=0.010), indicating that HRs and 95% CIs for prostate cancer incidence, comparing:
the association between hyperuricemia and prostate (i) individuals with hyperuricemia versus those with
cancer varies across the CTGF–CC and CTGF–T normouricemia, and (ii) participants in the higher serum
genotypes. A significant likelihood-ratio test confirmed uric acid quartiles (Q2-Q4) versus those in the lowest
that including this interaction substantially improved quartile (Q1), within each CTGF genotype. All estimates
model fit, making the “full model” the preferred basis were obtained using Cox proportional hazards models
for interpretation. adjusted for potential confounders.
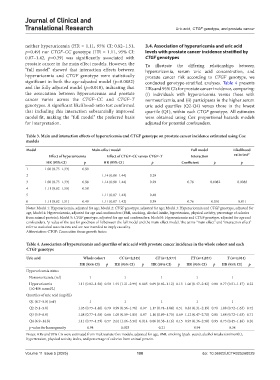
Table 3. Main and interaction effects of hyperuricemia and CTGF genotype on prostate cancer incidence estimated using Cox
models
Model Main‑effect model Full model Likelihood
Effect of hyperuricemia Effect of CTGF–CC versus CTGF–T Interaction ratio test*
HR (95% CI) p HR (95% CI) p Coefficient p p
1 1.00 (0.75–1.33) 0.99 – – – – –
2 – – 1.14 (0.90–1.44) 0.29 – – –
3 1.00 (0.75–1.33) 0.98 1.14 (0.90–1.44) 0.29 0.78 0.0082 0.0083
4 1.11 (0.82–1.50) 0.50 – – – – –
5 – – 1.11 (0.87–1.42) 0.40 – – –
6 1.11 (0.82–1.51) 0.49 1.11 (0.87–1.42) 0.39 0.76 0.010 0.011
Notes: Model 1: Hyperuricemia, adjusted for age; Model 2: CTGF genotype, adjusted for age; Model 3: Hyperuricemia and CTGF genotype, adjusted for
age; Model 4: Hyperuricemia, adjusted for age and confounders (BMI, smoking, alcohol intake, hypertension, physical activity, percentage of calories
from animal protein); Model 5: CTGF genotype, adjusted for age and confounders; Model 6: Hyperuricemia and CTGF genotype, adjusted for age and
confounders. *p-value of the test for goodness of fit between the full model and the main-effect model. The terms “main effect” and “interaction effect”
refer to statistical associations and are not intended to imply causality.
Abbreviation: CTGF: Connective tissue growth factor.
Table 4. Association of hyperuricemia and quartiles of uric acid with prostate cancer incidence in the whole cohort and each
CTGF genotype
Uric acid Whole cohort CC (n=2,245) CT (n=2,977) TT (n=1,037) T (n=4,014)
HR (95% CI) p HR (95% CI) p HR (95% CI) p HR (95% CI) p HR (95% CI) p
Hyperuricemia status
Normouricemia (ref) 1 1 1 1 1
Hyperuricemia 1.11 (0.82–1.50) 0.50 1.91 (1.21–2.99) 0.005 0.69 (0.42–1.12) 0.13 1.06 (0.47–2.42) 0.88 0.77 (0.51–1.17) 0.22
(≥0.416 mmol/L)
Quartiles of uric acid (mg/dL)
Q1 (0.7–5.0) (ref) 1 1 1 1 1
Q2 (5.1–5.8) 1.05 (0.75–1.46) 0.79 0.99 (0.56–1.76) 0.97 1.17 (0.74–1.84) 0.51 0.83 (0.31–2.19) 0.70 1.08 (0.72–1.63) 0.72
Q3 (5.9–6.8) 1.08 (0.77–1.50) 0.66 1.05 (0.59–1.85) 0.87 1.10 (0.69–1.75) 0.69 1.12 (0.47–2.70) 0.80 1.08 (0.72–1.63) 0.71
Q4 (6.9–14.8) 1.11 (0.77–1.59) 0.57 2.01 (1.16–3.50) 0.014 0.66 (0.38–1.16) 0.15 0.97 (0.36–2.58) 0.95 0.73 (0.45–1.18) 0.20
p-value for homogeneity 0.94 0.025 0.21 0.94 0.34
Notes: HRs and 95% CIs were estimated from multivariate Cox models, adjusted for age, BMI, smoking (pack-years), alcohol intake (oz/month),
hypertension, physical activity index, and percentage of calories from animal protein.
Volume 11 Issue 5 (2025) 100 doi: 10.36922/JCTR025260029