
Page 105 - JCTR-11-5
P. 105
Journal of Clinical and
Translational Research Uric acid, CTGF genotype, and prostate cancer
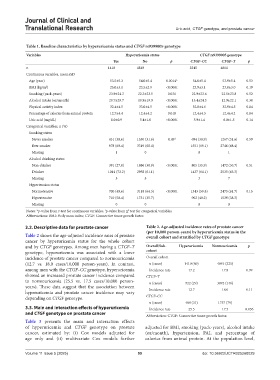
Table 1. Baseline characteristics by hyperuricemia status and CTGF rs9399005 genotype
Variables Hyperuricemia status CTGF rs9399005 genotype
Yes No p CTGF–CC CTGF–T p
n 1410 4849 2245 4014
Continuous variables, mean±SD
Age (year) 53.5±5.3 54.0±5.4 0.0014* 54.0±5.4 53.9±5.4 0.53
BMI (kg/m ) 25.0±3.1 23.5±2.9 <0.0001 23.9±3.1 23.8±3.0 0.19
2
Smoking (pack-years) 23.9±24.3 22.3±23.5 0.031 22.9±23.6 22.5±23.8 0.52
Alcohol intake (oz/month) 20.7±29.7 10.9±19.9 <0.0001 13.4±24.3 12.9±22.1 0.38
Physical activity index 32.4±4.5 33.0±4.5 <0.0001 32.8±4.6 32.9±4.5 0.84
Percentage of calories from animal protein 12.7±4.4 12.4±4.2 0.018 12.4±4.3 12.4±4.2 0.84
Uric acid (mg/dL) 8.0±0.9 5.4±1.0 <0.0001 5.9±1.4 6.0±1.5 0.14
Categorical variables, n (%)
Smoking status
Never smoker 431 (30.6) 1530 (31.6) 0.49 † 694 (30.9) 1267 (31.6) 0.59
Ever smoker 978 (69.4) 3319 (68.4) 1551 (69.1) 2746 (68.4)
Missing 1 0 0 1
Alcohol drinking status
Non-drinker 391 (27.8) 1886 (38.9) <0.0001 805 (35.9) 1472 (36.7) 0.51
Drinker 1014 (72.2) 2958 (61.1) 1437 (64.1) 2535 (63.3)
Missing 5 5 3 7
Hypertension status
Normotensive 700 (49.6) 3118 (64.3) <0.0001 1343 (59.8) 2475 (61.7) 0.15
Hypertensive 710 (50.4) 1731 (35.7) 902 (40.2) 1539 (38.3)
Missing 0 0 0 0
Notes: *p-value from t-test for continuous variables; p-value from χ test for categorical variables.
2
†
Abbreviations: BMI: Body mass index; CTGF: Connective tissue growth factor.
3.2. Descriptive data for prostate cancer Table 2. Age‑adjusted incidence rates of prostate cancer
(per 10,000 person‑years) by hyperuricemia status in the
Table 2 shows the age-adjusted incidence rates of prostate overall cohort and stratified by CTGF genotype
cancer by hyperuricemia status for the whole cohort
and by CTGF genotypes. Among men having a CTGF–T Overall/Sub‑ Hyperuricemia Normouricemia p
genotype, hyperuricemia was associated with a lower cohort
incidence of prostate cancer compared to normouricemia Overall cohort
(12.7 vs. 18.0 cases/10,000 person-years). In contrast, n (cases) 1410 (60) 4849 (225)
among men with the CTGF–CC genotype, hyperuricemia Incidence rate 17.2 17.8 0.99
showed an increased prostate cancer incidence compared CTGF–T
to normouricemia (25.5 vs. 17.5 cases/10,000 person- n (cases) 922 (29) 3092 (146)
years). These data suggest that the association between Incidence rate 12.7 18.0 0.11
hyperuricemia and prostate cancer incidence may vary
depending on CTGF genotype. CTGF–CC
n (cases) 488 (31) 1757 (79)
3.3. Main and interaction effects of hyperuricemia Incidence rate 25.5 17.5 0.036
and CTGF genotype on prostate cancer
Abbreviation: CTGF: Connective tissue growth factor.
Table 3 presents the main and interaction effects
of hyperuricemia and CTGF genotype on prostate adjusted for BMI, smoking (pack-years), alcohol intake
cancer, estimated by: (i) Cox models adjusted for (oz/month), hypertension, PAI, and percentage of
age only and (ii) multivariate Cox models further calories from animal protein. At the population level,
Volume 11 Issue 5 (2025) 99 doi: 10.36922/JCTR025260029