
Page 17 - JCTR-9-5
P. 17
Ji et al. | Journal of Clinical and Translational Research 2023; 9(5): 317-321 319
was 27.9 kg/m 6.0). The mean prebronchodilator FEV1 and FVC 4. Discussion
2 (
were 2.11 L (0.83) and 3.15 L (0.97), respectively. Thirty-one
participants (62%) had a prebronchodilator FEV1/FVC < 0.70. In our study, we observed a high level of concordance [14,15]
Regarding pulmonary disease, 14 participants (28%) had COPD, in the BDR after the inhalation of 400 µg of salbutamol through
®
®
®
and 22 (44%) had bronchial asthma (Table 1). both the Dosivent and Aerochamber Plus Flow-Vu chambers.
The median increases in FEV1 obtained with the Aerochamber
Plus Flow-Vu and Dosivent were 0.28 L (IQR: 0.21 – 0.38)
®
®
®
and 0.29 L (0.20 – 0.43), respectively; these differences were
non-significant (Table 2). The median increases in FVC were
0.29 L (0.19 – 0.37) and 0.28 L (188 – 453), also non-significant
(Table 3).
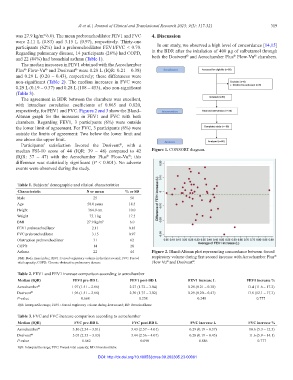
The agreement in BDR between the chambers was excellent,
with intraclass correlation coefficients of 0.865 and 0.820,
respectively, for FEV1 and FVC. Figures 2 and 3 show the Bland–
Altman graph for the increases in FEV1 and FVC with both
chambers. Regarding FEV1, 3 participants (6%) were outside
the lower limit of agreement. For FVC, 3 participants (6%) were
outside the limits of agreement: Two below the lower limit and
one above the upper limit.
Participants’ satisfaction favored the Dosivent , with a
®
median FSI-10 score of 44 (IQR: 39 – 48) compared to 42 Figure 1. CONSORT diagram.
(IQR: 37 – 47) with the Aerochamber Plus Flow-Vu ; this
®
®
difference was statistically significant (P < 0.001). No adverse
events were observed during the study.
Table 1. Subjects’ demographic and clinical characteristics
Characteristic N or mean % or SD
Male 25 50
Age 58.0 years 18.5
Height 164.0 cm 10.0
Weight 75.1 kg 17.5
BMI 27.9 kg/m 2 6.0
FEV1 prebronchodilator 2.11 0.83
FVC prebronchodilator 3.15 0.97
Obstruction prebronchodilator 31 62
COPD 14 28
Asthma 22 44 Figure 2. Bland-Altman plot representing concordance between forced
®
BMI: Body mass index; FEV1: Forced expiratory volume in the first second; FVC: Forced respiratory volume during first second increase with Aerochamber Plus
®
®
vital capacity; COPD: Chronic obstructive pulmonary disease Flow Vu and Dosivent .
Table 2. FEV1 and FEV1 increase comparison according to aerochamber
Median (IQR) FEV1 pre‑BD L FEV1 post‑BD L FEV1 increase L FEV1 increase %
Aerochamber ® 1.97 (1.51 – 2.66) 2.27 (1.72 – 3.04) 0.28 (0.21 – 0.38) 13.4 (11.6 – 17.2)
Dosivent ® 1.96 (1.51 – 2.66) 2.30 (1.75 – 3.02) 0.29 (0.20 – 0.43) 13.8 (12.1 – 17.3)
P-value 0.668 0.258 0.248 0.777
IQR: Interquartile range; FEV1: Forced respiratory volume during first second; BD: Bronchodilator.
Table 3. FVC and FVC increase comparison according to aerochamber
Median (IQR) FVC pre‑BD L FVC post‑BD L FVC increase L FVC increase %
Aerochamber ® 3.10 (2.34 – 3.81) 3.43 (2.57 – 4.01) 0.29 (0.19 – 0.37) 10.6 (5.3 – 12.5)
Dosivent ® 3.05 (2.35 – 3.83) 3.44 (2.56 – 4.07) 0.28 (0.19 – 0.45) 11.6 (5.9 – 14.1)
P-value 0.662 0.090 0.886 0.777
IQR: Interquartile range; FVC: Forced vital capacity; BD: Bronchodilator.
DOI: http://dx.doi.org/10.18053/jctres.09.202305.23-00081