
Page 80 - MI-1-2
P. 80
Microbes & Immunity Hydrogen alleviates non-alcoholic fatty liver disease
A B
C
D E
F
G H I
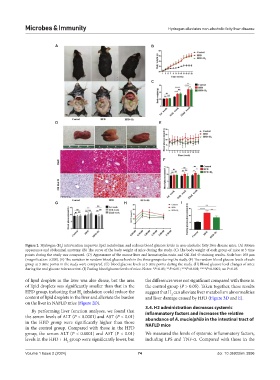
Figure 2. Hydrogen (H ) intervention improves lipid metabolism and reduces blood glucose levels in non-alcoholic fatty liver disease mice. (A) Mouse
2
appearance and abdominal anatomy. (B) The curve of the body weight of mice during the study. (C) The body weight of each group of mice at 3 time
points during the study was compared. (D) Appearance of the mouse liver and hematoxylin-eosin and Oil Red O staining results. Scale bar: 100 µm
(magnification: ×200). (E) The variation in random blood glucose levels in the three groups during the study. (F) The random blood glucose levels of each
group at 3 time points in the study were compared. (G) Blood glucose levels at 3 time points during the study. (H) Blood glucose level changes of mice
during the oral glucose tolerance test. (I) Fasting blood glucose levels of mice. Notes: *P<0.05; **P<0.01; ***P<0.001; ****P<0.0001; ns: P>0.05.
of lipid droplets in the liver was also dense, but the area the differences were not significant compared with those in
of lipid droplets was significantly smaller than that in the the control group (P > 0.05). Taken together, these results
HFD group, indicating that H inhalation could reduce the suggest that H can alleviate liver metabolism abnormalities
2
2
content of lipid droplets in the liver and alleviate the burden and liver damage caused by HFD (Figure 3D and E).
on the liver in NAFLD mice (Figure 2D).
3.4. H2 administration decreases systemic
By performing liver function analyses, we found that inflammatory factors and increases the relative
the serum levels of ALT (P < 0.0001) and AST (P < 0.01) abundance of A. muciniphila in the intestinal tract of
in the HFD group were significantly higher than those NAFLD mice
in the control group. Compared with those in the HFD
group, the serum ALT (P < 0.0001) and AST (P < 0.01) We measured the levels of systemic inflammatory factors,
levels in the HFD + H group were significantly lower, but including LPS and TNF-α. Compared with those in the
2
Volume 1 Issue 2 (2024) 74 doi: 10.36922/mi.3896