
Page 78 - MI-1-2
P. 78
Microbes & Immunity Hydrogen alleviates non-alcoholic fatty liver disease
A
B
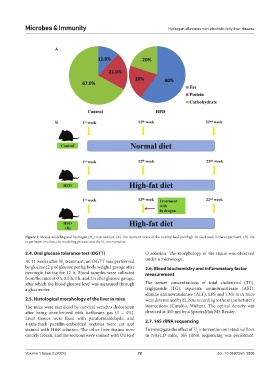
Figure 1. Mouse modeling and hydrogen (H ) intervention. (A) The nutrient ratios of the normal feed and high-fat feed used in the experiment. (B) The
2
experiment involves the modeling process and the H intervention.
2
2.4. Oral glucose tolerance test (OGTT) O solution. The morphology of the tissue was observed
At 11 weeks after H treatment, an OGTT was performed under a microscope.
2
by glucose (2 g of glucose per kg body weight) gavage after 2.6. Blood biochemistry and inflammatory factor
overnight fasting for 12 h. Blood samples were collected measurement
from the mice at 0 h, 0.5 h, 1 h, and 2 h after glucose gavage,
after which the blood glucose level was measured through The serum concentrations of total cholesterol (TC),
a glucometer. triglyceride (TG), aspartate aminotransferase (AST),
alanine aminotransferase (ALT), LPS and TNF-α in mice
2.5. Histological morphology of the liver in mice were determined by ELISAs according to the manufacturer’s
The mice were sacrificed by cervical vertebra dislocation instructions (Cusabio, Wuhan). The optical density was
after being anesthetized with isoflurane gas (3 – 4%). detected at 450 nm by a SpectraMax M5 Reader.
Liver tissues were fixed with paraformaldehyde, and 2.7. 16S rRNA sequencing
4-µm-thick paraffin-embedded sections were cut and
stained with H&E solution. The other liver tissues were To investigate the effect of H intervention on intestinal flora
2
quickly frozen, and the sections were stained with Oil Red in NAFLD mice, 16S rRNA sequencing was performed.
Volume 1 Issue 2 (2024) 72 doi: 10.36922/mi.3896