
Page 144 - MI-2-3
P. 144
Microbes & Immunity Characterizing low-grade CNS tumors
A B C D
E F G
K
H I J
O
L M N
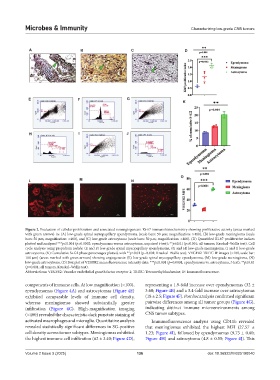
Figure 2. Evaluation of cellular proliferation and associated neoangiogenesis. Ki-67 immunohistochemistry showing proliferative activity (areas marked
with green arrows) in: (A) low-grade spinal myxopapillary ependymoma (scale bars: 50 µm; magnification: ×400), (B) low-grade meningioma (scale
bars: 50 µm; magnification: ×400), and (C) low-grade astrocytoma (scale bars: 50 µm; magnification: ×400). (D) Quantified Ki-67 proliferative indices
plotted and analyzed ***p≤0.001 (p=0.0002; ependymoma versus astrocytoma, unpaired t-test); **p≤0.01 (p=0.001; all tumors, Kruskal–Wallis test). Cell
cycle analysis using propidium iodide: (E and F) low-grade spinal myxopapillary ependymoma, (G and H) low-grade meningioma, (I and J) low-grade
astrocytoma. (K) Cumulative S+G2 phase percentages plotted, with **p≤0.01 (p=0.001; Kruskal–Wallis test). VEGFR2-TRITC IF images (×100, scale bar:
100 µm) (areas marked with green arrows) showing angiogenesis: (L) low-grade spinal myxopapillary ependymoma, (M) low-grade meningioma, (N)
low-grade astrocytoma. (O) Box plot of VEGFR2 mean fluorescence intensity data: ***p≤0.001 (p=0.0001; ependymoma vs. astrocytoma, t-test); **p≤0.01
(p=0.001; all tumors, Kruskal–Wallis test).
Abbreviations: VEGFR2: Vascular endothelial growth factor receptor 2; TRITC: Tetramethylrhodamine; IF: Immunofluorescence.
components of immune cells. At low magnification (×100), representing a 1.9-fold increase over ependymomas (32 ±
ependymomas (Figure 4A) and astrocytomas (Figure 4E) 3.60; Figure 4B) and a 3.4-fold increase over astrocytomas
exhibited comparable levels of immune cell density, (18 ± 2.5; Figure 4F). Post hoc analysis confirmed significant
whereas meningiomas showed substantially greater pairwise differences among all tumor groups (Figure 4G),
infiltration (Figure 4C). High-magnification imaging indicating distinct immune microenvironments among
(×400) revealed the characteristic dark punctate staining of CNS tumor subtypes.
activated macrophages and microglia. Quantitative analysis Immunofluorescence analysis using CD11b revealed
revealed statistically significant differences in SG-positive that meningiomas exhibited the highest MFI (27.57 ±
cell density across tumor subtypes. Meningiomas exhibited 1.23; Figure 4I), followed by ependymomas (9.73 ± 0.60;
the highest immune cell infiltration (62 ± 3.40; Figure 4D), Figure 4H) and astrocytoma (4.8 ± 0.55; Figure 4J). This
Volume 2 Issue 3 (2025) 136 doi: 10.36922/MI025190040