
Page 146 - MI-2-3
P. 146
Microbes & Immunity Characterizing low-grade CNS tumors
pattern was consistent with the SG staining results and 3.5. DNMT1 expression and epigenetic regulation
confirms a predominance of CD11b myeloid cells in patterns
+
meningioma microenvironments.
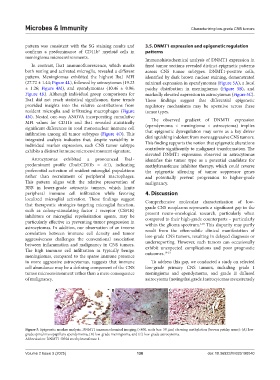
Immunohistochemical analysis of DNMT1 expression in
In contrast, Iba1 immunofluorescence, which marks fixed tumor sections revealed distinct epigenetic patterns
both resting and activated microglia, revealed a different across CNS tumor subtypes. DNMT1-positive cells,
pattern. Meningiomas exhibited the highest Iba1 MFI identified by dark brown nuclear staining, demonstrated
(27.72 ± 1.44; Figure 4L), followed by astrocytomas (19.23 minimal expression in ependymomas (Figure 5A), a focal
± 1.26; Figure 4M), and ependymomas (10.46 ± 0.96; patchy distribution in meningiomas (Figure 5B), and
Figure 4K). Although individual group comparisons for markedly elevated expression in astrocytomas (Figure 5C).
Iba1 did not reach statistical significance, these trends These findings suggest that differential epigenetic
provided insights into the relative contributions from regulatory mechanisms may be operative across these
resident microglia and infiltrating macrophages (Figure tumor types.
4N). Nested one-way ANOVA incorporating cumulative
The observed gradient of DNMT1 expression
MFI values for CD11b and Iba1 revealed statistically (ependymoma < meningioma < astrocytoma) implies
significant differences in total mononuclear immune cell that epigenetic dysregulation may serve as a key driver
infiltration among all tumor subtypes (Figure 4O). This
integrated analysis indicates that, despite variability in distinguishing indolent from more aggressive CNS tumors.
individual marker expression, each CNS tumor subtype This finding supports the notion that epigenetic alterations
exhibits a distinct immune microenvironment signature. contribute significantly to malignant transformation. The
elevated DNMT1 expression observed in astrocytomas
Astrocytomas exhibited a pronounced Iba1- identifies this tumor type as a potential candidate for
predominant profile (Iba1:CD11b = 4:1), indicating methyltransferase inhibitor therapy, which could reverse
preferential activation of resident microglial populations the epigenetic silencing of tumor suppressor genes
rather than recruitment of peripheral macrophages. and potentially prevent progression to higher-grade
This pattern aligns with the relative preservation of malignancy.
BBB in lower-grade astrocytic tumors, which limits
peripheral immune cell infiltration while favoring 4. Discussion
localized microglial activation. These findings suggest Comprehensive molecular characterization of low-
that therapeutic strategies targeting microglial function, grade CNS neoplasms represents a significant gap in the
such as colony-stimulating factor 1 receptor (CSF1R) present neuro-oncological research, particularly when
inhibitors or microglial repolarization agents, may be compared to their high-grade counterparts – particularly
particularly effective in preventing tumor progression in within the glioma spectrum. This disparity may partly
1,18
astrocytomas. In addition, our observation of an inverse result from the often-subtle clinical manifestation of
correlation between immune cell density and tumor low-grade CNS tumors, resulting in delayed diagnosis or
aggressiveness challenges the conventional association
between inflammation and malignancy in CNS tumors. underreporting. However, such tumors can occasionally
The high immune cell infiltration in typically benign exhibit unexpected complications and poor prognostic
19-21
meningiomas, compared to the sparse immune presence outcomes.
in more aggressive astrocytomas, suggests that immune To address this gap, we conducted a study on selected
cell abundance may be a defining component of the CNS low-grade primary CNS tumors, including grade I
tumor microenvironment rather than a mere consequence meningioma and ependymoma, and grade II diffused
of malignancy. astrocytoma (noting that grade I astrocytomas are extremely
A B C
Figure 5. Epigenetic marker analysis. DNMT1 immunochemical imaging (×400, scale bar: 50 µm) showing methylation (brown patchy areas): (A) low-
grade spinal myxopapillary ependymoma, (B) low-grade meningioma, and (C) low-grade astrocytoma.
Abbreviation: DNMT1: DNA methyltransferase 1.
Volume 2 Issue 3 (2025) 138 doi: 10.36922/MI025190040