
Page 148 - MI-2-3
P. 148
Microbes & Immunity Characterizing low-grade CNS tumors
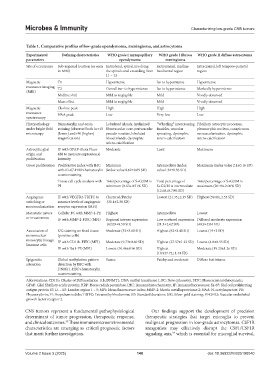
Table 1. Comparative profiles of low‑grade ependymoma, meningioma, and astrocytoma
Experimental Defining characteristics WHO grade I myxopapillary WHO grade I fibrous WHO grade II diffuse astrocytoma
parameters ependymoma meningioma
Site of occurrence Sub-regional location (as seen Extradural, spinal, involving Extracranial, midline Intracranial, left temporo-parietal
in MRI) the spinal canal extending from basifrontal region region
L1 – L5
Magnetic T1 Hypointense Iso to hypointense Hypointense
resonance imaging T2 Overall iso- to hyperintense Iso to hyperintense Markedly hyperintense
(MRI)
Midline shift Mild to negligible Mild Vividly observed
Mass effect Mild to negligible Mild Vividly observed
Magnetic Choline peak High High High
resonance NAA peak Low Very low Low
spectroscopy
Histopathology Hematoxylin and eosin Lobulated islands, hyalinized “Whorling” intercrossing Fibrillary astrocytic processes,
under bright field staining (observed both in×10 fibrovascular core, perivascular fascicles, vascular pleomorphic nucleus, conspicuous
microscopy [lower] and×40 [higher] pseudo-rosettes, lobulated sprouting, dystrophic neovascularization, dystrophic
magnification) blood islands, dystrophic micro-calcification micro-calcification
micro-calcification
Astrocytic glial IF with GFAP-Alexa Fluor Moderate Least Maximum
origin and 488 to measure expressional
proliferation intensity
Gross proliferation Proliferative index with IHC Minimum Intermediate (index Maximum (index value 2.1±0.16 SD)
with Ki-67-HRP+hematoxylin (index value 0.62±0.09 SD) value1.34±0.36 SD)
counterstaining
Tissue cell cycle analysis with Total percentage of S+G2/M is Total percentage of Total percentage of S+G2/M is
PI minimum (8.63±0.51% SD) S+G2/M is intermediate maximum (20.40±2.06% SD)
(12.60±0.70% SD)
Angiogenic IF with VEGFR2-TRITC to Clustered/Patchy Lowest (21.35±2.35 SD) Highest (59.66±2.55 SD)
switching or measure levels of angiogenic (30.1±2.38 SD)
neovascularization receptor expression (MFI)
Metastatic nature Cellular FC with MMP-2-PE Highest Intermediate Lowest
or invasiveness IF with MMP-2-FITC (MFI) Regional intense expression Low scattered expression Diffused moderate expression
(62.03±9.50 SD) (21.3±2.62 SD) (40.9±2.04 SD)
Association of S/G staining on fixed tissue Moderate (32±3.60 SD) Highest (62±3.40 SD) Lowest (19±2 SD)
mononuclear (positive cells)
monocytic lineage IF with CD11b-FITC (MFI) Moderate (9.73±0.60 SD) Highest (27.57±1.23 SD) Lowest (4.8±0.55 SD)
Immune cells
IF with Iba1-PE (MFI) Lowest (10.46±0.96 SD) Highest Moderate (19.23±1.26 SD)
(18.927.72±1.44 SD)
Epigenetic Global methylation pattern Scarce Patchy and moderate Diffuse but intense
alteration detection by IHC with
DNMT1-HRP+hematoxylin
counterstaining
Abbreviations: CD11b: Cluster of Differentiation 11b; DNMT1: DNA methyl transferase 1; FC: Flow cytometry; FITC: Fluorescein isothiocyanate;
GFAP: Glial fibrillary acidic protein; HRP: Horse radish peroxidase; IHC: Immunohistochemistry; IF: Immunofluorescence; Ki-67: Kiel cell proliferating
antigen protein 67; L1 – L5: Lumber region 1 – 5; MFI: Mean fluorescence index; MMP-2: Matrix metalloproteinase 2; NAA: N-acetylaspartate; PE:
Phycoerythrin; PI: Propidium iodide; TRITC: Tetramethylrhodamine; SD: Standard deviation; S/G: Silver-gold staining; VEGFR2: Vascular endothelial
growth factor receptor 2.
CNS tumors represent a fundamental pathophysiological Our findings support the development of precision
determinant of tumor progression, therapeutic response, therapeutic strategies that target microglia to prevent
and clinical outcomes. These immune microenvironmental malignant progression in low-grade astrocytomas. CSF1R
33
characteristics are emerging as critical prognostic factors antagonists may effectively disrupt the CSF1/CSF1R
that merit further investigation. signaling axis, which is essential for microglial survival,
34
Volume 2 Issue 3 (2025) 140 doi: 10.36922/MI025190040