
Page 145 - MI-2-3
P. 145
Microbes & Immunity Characterizing low-grade CNS tumors
A B C G
D E F
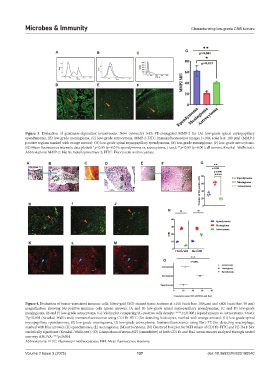
Figure 3. Evaluation of gelatinase-dependent invasiveness. Flow cytometry with PE-conjugated MMP-2 for (A) low-grade spinal myxopapillary
ependymoma, (B) low-grade meningioma, (C) low-grade astrocytoma. MMP-2-FITC immunofluorescence images (×100, scale bar: 100 µm) (MMP-2
positive regions marked with orange arrows): (D) low-grade spinal myxopapillary ependymoma, (E) low-grade meningioma, (F) low-grade astrocytoma.
(G) Mean fluorescence intensity data plotted: *p≤0.05 (p=0.019; ependymoma vs. astrocytoma, t-test); **p≤0.01 (p=0.001; all tumors, Kruskal–Wallis test).
Abbreviations: MMP-2: Matrix metalloproteinase 2; FITC: Fluorescein isothiocyanate.
A B C D E F G
H I J
N
K L M
O
Figure 4. Evaluation of tumor-associated immune cells. Silver-gold (SG)-stained tissue sections at ×100 (scale bar: 100 µm) and ×400 (scale bar: 50 µm)
magnification showing SG-positive immune cells (green arrows): (A and B) low-grade spinal myxopapillary ependymoma, (C and D) low-grade
meningioma, (E and F) low-grade astrocytoma. (G) Violin plot comparing SG-positive cells density: ****p≤0.0001 (ependymoma vs. astrocytoma, t-test);
**p≤0.001 (Kruskal–Wallis test); Immunofluorescence using CD11b-FITC (for detecting leukocytes, marked with orange arrows): (H) low-grade spinal
myxopapillary ependymoma, (I) low-grade meningioma, (J) low-grade astrocytoma. Immunofluorescence using Iba1-PE (for detecting macrophage,
marked with blue arrows): (K) ependymoma, (L) meningioma, (M) astrocytoma. (N) Clustered box plot for MFI values of CD11b-FITC and PE-Iba1: Not
statistically significant (Kruskal–Wallis test). (O) Comparison of mean MFI (cumulative) of both CD11b and Iba1 across tumors analyzed through nested
one-way ANOVA: ***p≤0.001.
Abbreviations: FITC: Fluorescein isothiocyanate; MFI: Mean fluorescence intensity.
Volume 2 Issue 3 (2025) 137 doi: 10.36922/MI025190040