
Page 144 - MSAM-4-2
P. 144
Materials Science in Additive Manufacturing Bi-modal powder spreading behavior of ceramics
A B
C
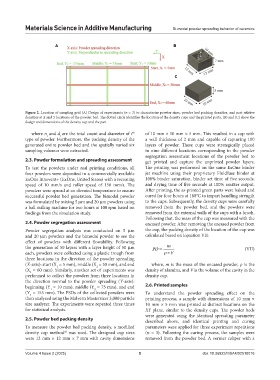
Figure 2. Location of sampling grid (A) Design of experiments (n = 3) to characterize powder sizes, powder bed packing densities, and part relative
densities at X and Y locations of the powder bed. The dotted circle identifies the location of the density cups and the printed parts. (B) and (C) show the
design and dimensions of the density cup and the part
where n and d are the total count and diameter of i of 10 mm × 10 mm × 5 mm. This resulted in a cup with
th
i
i
type of powder. Furthermore, the packing density of the a wall thickness of 2 mm and capable of capturing 100
generated entire powder bed and the spatially varied six layers of powder. These cups were strategically placed
sampling volumes were extracted. in nine different locations corresponding to the powder
segregation assessment locations of the powder bed to
2.3. Powder formulation and spreading assessment get printed and capture the unprinted powder layers.
To test the powders under real printing conditions, all The printing was performed on the same ExOne binder
four powders were deposited in a commercially available jet machine using their proprietary Fluidfuse binder at
ExOne Innovent+ (ExOne, United States) with a recoating 100% binder saturation, binder set time of five seconds,
speed of 10 mm/s and roller speed of 150 mm/s. The and drying time of five seconds at 100% emitter output.
powders were spread at an elevated temperature to ensure After printing, the as-printed green parts were baked and
successful powder bed generation. The bimodal powder cured for four hours at 180°C to impart handling strength
was formulated by mixing 5 µm and 20 µm powders using to the cups. Subsequently, the density cups were carefully
a ball milling machine for two hours at 100 rpm based on removed from the powder bed, and the powders were
findings from the simulation study. removed from the external walls of the cups with a brush.
Following that, the mass of the cup was measured with the
2.4. Powder segregation assessment encased powder. After removing the encased powder from
Powder segregation analysis was conducted on 5 µm the cup, the packing density of the location of the cup was
and 20 µm powders and the bimodal powder to see the calculated based on Equation VII:
effect of powders with different flowability. Following
the generation of 50 layers with a layer height of 50 µm PD = m (VII)
each, powders were collected using a plastic trough from ρ × V
three locations in the direction of the powder spreading
(X-axis): start (X = 5 mm), middle (X = 30 mm), and end where, m is the mass of the encased powder, ρ is the
1
2
(X = 60 mm). Similarly, another set of experiments was density of alumina, and V is the volume of the cavity in the
3
performed to collect the powders from three locations in density cup.
the direction normal to the powder spreading (Y-axis):
beginning (Y = 10 mm), middle (Y = 75 mm), and end 2.6. Printed samples
1
2
(Y = 155 mm). The PSDs of the collected powders were To understand the powder spreading effect on the
3
then analyzed using the Malvern Mastersizer 3,000 particle printing process, a sample with dimensions of 10 mm ×
size analyzer. The experiments were repeated three times 10 mm × 5 mm was printed at distinct locations on the
for statistical analysis. XY plane, similar to the density cups. The powder beds
were generated using the identical spreading parameter
2.5. Powder bed packing density described above, and identical printing and curing
To measure the powder bed packing density, a modified parameters were applied for three experiment repetitions
density cup method was used. The designed cup sizes (n = 3). Following the curing process, the samples were
66
were 12 mm × 12 mm × 7 mm with cavity dimensions removed from the powder bed. A vernier caliper with a
Volume 4 Issue 2 (2025) 5 doi: 10.36922/MSAM02510016