
Page 143 - MSAM-4-2
P. 143
Materials Science in Additive Manufacturing Bi-modal powder spreading behavior of ceramics
D 33 . 28 . D D 27. as capillary forces or humidity-induced agglomeration,
τ 12, =− 1− 2 − 2 1− 2 (V) were also not considered in the model, although they may
1
D 1 D 1 D 1 influence powder behavior in experimental conditions.
In addition, inter-particle interactions were represented
This study uses these equations to get the packing using simplified force models that approximate cohesion
density of the bimodal powder used in the simulation of and friction.
this study. The mixing ratios were analyzed based on the
computational study by Shahed et al., and a volumetric Following the settling simulation, a spreading
6
ratio of 75%/25% was derived for 5 µm and 20 µm powders, simulation was performed to mimic the recoating process
resulting in a packing density of 0.71. to generate the powder bed. A representative distribution
of the bimodal powders (PSD that ranges from 2 µm, 4
Discrete element modeling simulations were conducted µm, 5 µm, 10 µm, 15 µm, 18 µm, and 20 µm) was used
using Flow3D (Flow Science Inc., United States) to to generate the powder bed (e.g., 2 µm, 4 µm, and 5 µm
generate representative powder beds with a mesh size powders were used to represent the PSD of the 5 µm
of 0.22 mm. The DEM simulation was conducted using powder, and 10 µm, 15 µm, 18 µm, and 20 µm were used to
a cross-sectional representation of the actual system, represent the PSD of the 20 µm powder). As the spreading
measuring 4 cm × 1.625 cm, scaled down by a factor of mechanism, a counter-rotating roller (0.4 cm diameter) was
four to reduce computational costs. A layer height of 50 simulated with a traverse speed of 0.15 m/s at 250 rpm. The
µm was maintained throughout the simulation. To analyze particles are defined as discrete rigid bodies, and the details
particle distribution, sampling volumes were defined of setting up the simulation can be found in Shahed et al. .
6
along two orientations: 4 cm × 0.1 cm × 0.005 cm in the Three sampling volumes were set up in the X-axis (parallel
spreading direction and 1.625 cm × 0.1 cm × 0.005 cm to the spreading direction) at the beginning, middle, and
perpendicular to the spreading direction. These volumes end of the powder bed. Similarly, three sampling volumes
were used to quantify the deposition of both large and were set up on the Y-axis (perpendicular to the spreading
small solid particles within the simulated domain. In direction), as shown in Figure 2. The rationale for studying
addition, this powder settling simulation is representative these multiple sampling volumes was to capture any
of the overhang powder deposition system, as shown in variations in powder packing quality at different stages of
Figure 1. the spreading cycle and across both the edges and center
To ensure computational efficiency and tractability, of the powder bed, thereby testing our hypothesis. From
the DEM simulations in this study involved several the count of the particles, the average size of particles in
assumptions as used in previous studies. 34,36,46,65 All the sampling volume was calculated using the following
particles were modeled as discrete, rigid spheres to Equation VI:
simplify contact interactions and reduce simulation ∑ nd .
complexity. As a result, any particle deformation during d avg = i i (VI)
collisions was neglected. Moisture-related effects, such ∑ n i
A B
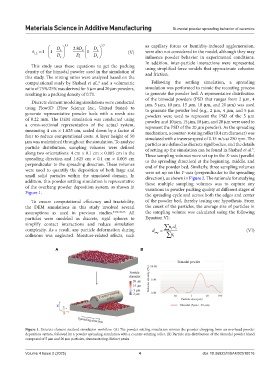
Figure 1. Discrete element method simulation workflow. (A) The powder settling simulation mimics the powder dropping from an overhead powder
deposition system, followed by a powder spreading simulation with a counter-rotating roller. (B) Particle size distribution of the bimodal powder blend
composed of 5 µm and 20 µm particles, demonstrating distinct peaks
Volume 4 Issue 2 (2025) 4 doi: 10.36922/MSAM02510016