
Page 85 - MSAM-4-2
P. 85
Materials Science in Additive Manufacturing Quality of a 3D-printed steel part
The results exhibited slight variations when compared to production process is necessary to fully elucidate the origin
typical values provided by material suppliers, as detailed of this discrepancy.
in Table 1. As anticipated, the particle size distribution shown in
Although the measured Ni content (14.39 wt.%) fell Figure 6 exhibits a Gaussian-like trend, with characteristic
below the nominal range (17 – 19 wt.%), subsequent values of d = 17.5, d = 29.8, and d = 50.7 μm. However,
10
90
50
analysis confirmed that this shortfall did not significantly these values are slightly lower than those typically reported
impact the printing process, mechanical properties, or by commercial suppliers, whose size range falls between
phase stability of the maraging steel. In these alloys, Ni is 20 and 60 μm. Furthermore, Figure 4 reveals a notable
49
crucial for stabilizing the martensitic phase and promoting presence of satellite particles with diameters around 15
intermetallic precipitation during aging, and small Ni μm. It is important to note that powder particles smaller
25
fluctuations can shift the martensitic start and finish than 10–20 μm can negatively impact powder flowability
temperatures, potentially altering the fraction of retained and should generally be minimized. However, no flow-
austenite. Nevertheless, our hardness and mechanical related issues were encountered during the manufacturing
45
tests revealed that the modest Ni deviation did not process. The powder spread evenly and smoothly across the
measurably affect the martensitic matrix or precipitation build platform, forming a uniform layer free of air voids.
hardening response. Further investigation into the powder This behavior can be attributed to the high surface quality
and consistent particle morphology of the powder, both of
which are essential for optimal flowability. As a result, no
50
significant surface defects, such as porosity, were detected
in the final printed part, allowing for reduced surface
roughness. To ensure measurement consistency, multiple
tests were conducted to minimize the relative standard
deviation, as shown in Figure 6, where five analyses were
performed for each of the eight tests presented.
3.2. Visual inspection, dimensional quality, and
roughness
The maraging steel demonstration part shown in Figure 3
was 3D-printed in approximately six hours without
requiring any support structures. It was produced directly
from the WZA file generated by the TRUMPF Build
Processor, in the lay-down orientation illustrated. The final
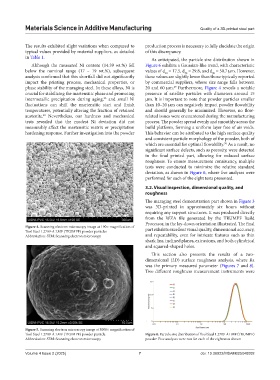
Figure 4. Scanning electron microscopy image at 190× magnification of
Tool Steel 1.2709-A LMF (TRUMPF) powder particles part exhibits excellent visual quality, dimensional accuracy,
Abbreviation: SEM: Scanning electron microscopy and repeatability, even for intricate features such as thin
shark fins, inclined planes, extrusions, and both cylindrical
and squared-shaped holes.
This section also presents the results of a two-
dimensional (2D) surface roughness analysis, where Ra
was the primary measured parameter (Figures 7 and 8).
Two different roughness measurement instruments were
Figure 5. Scanning electron microscopy image at 3000× magnification of
Tool Steel 1.2709-A LMF (TRUMPF) powder particle Figure 6. Particle size distribution of Tool Steel 1.2709-A LMF (TRUMPF)
Abbreviation: SEM: Scanning electron microscopy powder. Five analyses were run for each of the eight tests shown
Volume 4 Issue 2 (2025) 7 doi: 10.36922/MSAM025040002