
Page 87 - MSAM-4-2
P. 87
Materials Science in Additive Manufacturing Quality of a 3D-printed steel part
detector. Data acquisition was performed over a 2θ range under rapid solidification conditions, confirming that the
of 20–120°, with a step size of 0.02°, an exposure time of 0.5 LPBF process yields the expected martensitic matrix with
s per step, and a spin rate of 15 rpm. Rietveld refinements minimal retained austenite. The slight Ni deficiency relative
were carried out using the TOPAS 5.0 software (Bruker to the nominal composition might influence precipitation
AXS, Germany) following the fundamental parameters kinetics during the aging process. Nonetheless, our XRD
approach. and hardness measurements confirm that the material
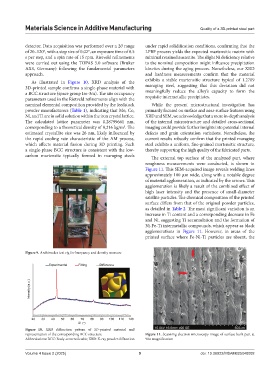
As illustrated in Figure 10, XRD analysis of the exhibits a stable martensitic structure typical of 1.2709
3D-printed sample confirms a single-phase material with maraging steel, suggesting that this deviation did not
a BCC structure (space group Im-3m). The site occupancy meaningfully reduce the alloy’s capacity to form the
parameters used in the Rietveld refinements align with the requisite intermetallic precipitates.
nominal elemental composition provided by the feedstock While the present microstructural investigation has
powder manufacturers (Table 1), indicating that Mo, Co, primarily focused on surface and near-surface features using
Ni, and Ti are in solid solution within the iron crystal lattice. XRD and SEM, we acknowledge that a more in-depth analysis
The calculated lattice parameter was 0.28799661 nm, of the internal microstructure and detailed cross-sectional
corresponding to a theoretical density of 8,216 kg/m . The imaging could provide further insights into potential internal
3
estimated crystallite size was 26 nm, likely influenced by defects and grain orientation variations. Nonetheless, the
the rapid cooling rate characteristic of the AM process, current results robustly confirm that the printed maraging
which affects material fusion during 3D printing. Such steel exhibits a uniform, fine-grained martensitic structure,
a single-phase BCC structure is consistent with the low- thereby supporting the high quality of the fabricated parts.
carbon martensite typically formed in maraging steels The external top surface of the analyzed part, where
roughness measurements were conducted, is shown in
Figure 11. This SEM-acquired image reveals welding lines
approximately 100 μm wide, along with a notable degree
of material agglomeration, as indicated by the arrows. This
agglomeration is likely a result of the combined effect of
high laser intensity and the presence of small-diameter
satellite particles. The chemical composition of the printed
surface differs from that of the original powder particles,
as detailed in Table 2. The most significant variation is an
increase in Ti content and a corresponding decrease in Fe
and Ni, suggesting Ti accumulation and the formation of
Ni-Fe-Ti intermetallic compounds, which appear as black
agglomerations in Figure 11. However, in areas of the
printed surface where Fe-Ni-Ti particles are absent, the
Figure 9. Archimedes test rig for buoyancy and density measure
Experimental Fitting Difference
Intensity (a.u.)
20 30 40 50 60 70 80 90 100 110 120
2!
Figure 10. XRD diffraction pattern of 3D-printed material and
representation of the corresponding BCC structure Figure 11. Scanning electron microscopy image of surface built part at
Abbreviations: BCC: Body-centered cubic; XRD: X-ray powder diffraction 90× magnification
Volume 4 Issue 2 (2025) 9 doi: 10.36922/MSAM025040002