
Page 89 - MSAM-4-2
P. 89
Materials Science in Additive Manufacturing Quality of a 3D-printed steel part
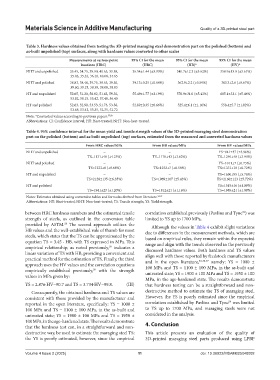
Table 3. Hardness values obtained from testing the 3D‑printed maraging steel demonstration part on the polished (bottom) and
as‑built unpolished (top) surfaces, along with hardness values converted to other scales
Measurements at various point 95% CI for the mean 95% CI for the mean 95% CI for the mean
locations (HRC) (HRC) (HB)* (HV)*
NHT and unpolished 35.45, 34.75, 38.90, 40.65, 33.58, 36.54±1.44 (±3.93%) 340.7±12.3 (±3.62%) 358.9±13.0 (±3.61%)
35.83, 35.33, 36.18, 40.08, 34.65
NHT and polished 38.83, 38.48, 39.75, 38.65, 39.50, 39.13±0.25 (±0.64%) 362.9±2.2 (±0.59%) 383.3±2.6 (±0.67%)
39.60, 39.15, 39.38, 39.08, 38.83
HT and unpolished 52.65, 51.20, 58.82, 51.63, 59.30, 55.49±1.77 (±3.19%) 570.9±31.0 (±5.43%) 605.1±33.1 (±5.46%)
53.82, 58.15, 55.42, 57.48, 56.40
HT and polished 52.63, 52.90, 53.53, 51.73, 53.58, 52.89±0.35 (±0.66%) 525.4±6.1 (±1.16%) 558.4±5.7 (±1.02%)
52.68, 53.42, 53.35, 52.35, 52.72
Note: *Converted values according to previous papers. 57,58
Abbreviations: CI: Confidence interval; HT: Heat-treated; NHT: Non-heat-treated.
Table 4. 95% confidence interval for the mean yield and tensile strength values of the 3D‑printed maraging steel demonstration
part on the polished (bottom) and as‑built unpolished (top) surfaces, estimated from the measured and converted hardness values
From HRC values/MPa From HB values/MPa From HV values/MPa
NHT and unpolished − − YS=941±37 (±3.96%)
TS=1131±48 (±4.25%) TS=1176±43 (±3.62%) TS=1240±48 (±3.90%)
NHT and polished − − YS=1011±7 (±0.73%)
TS=1223±8 (±0.68%) TS=1252±7 (±0.58%) TS=1331±10 (±0.72%)
HT and unpolished − − YS=1650±95 (±5.76%)
TS=2128±135 (±6.35%) TS=1969±107 (±5.43%) TS=2160±123 (±5.72%)
HT and polished − − YS=1515±16 (±1.09%)
TS=1941±23 (±1.20%) TS=1812±21 (±1.16%) TS=1985±21 (±1.08%)
Notes: Estimates obtained using conversion tables and formulas derived from literature. 58,59
Abbreviations: HT: Heat-treated; NHT: Non-heat-treated; TS: Tensile strength; YS: Yield strength.
between HRC hardness numbers and the estimated tensile correlation established previously (Pavlina and Tyne ) was
59
strength of steels, as outlined in the conversion table limited to YS up to 1700 MPa.
58
provided by ASTM. The second approach utilizes the Although the values in Table 4 exhibit slight variations
HB values and the well-established rule of thumb for most due to differences in the measurement methods, which are
steels, which states that the TS can be approximated by the based on empirical rules, they remain within the expected
equation TS = 3.45 · HB, with TS expressed in MPa. This range and align with the trends observed in the previously
empirical relationship, as noted previously, indicates a discussed hardness values. Both hardness and TS values
59
linear variation of TS with HB, providing a convenient and align well with those reported by feedstock manufacturers
practical method for the estimation of TS. Finally, the third and in the open literature, 36-38,47 namely: YS = 1000 ±
approach uses the HV values and the correlation equations 100 MPa and TS = 1100 ± 100 MPa, in the as-built and
empirically established previously, with the strength untreated state; YS = 1900 ± 100 MPa and TS = 1950 ± 100
59
values in MPa given by:
MPa, in the age-hardened state. The results demonstrate
YS = 2.876·HV−90.7 and TS = 3.734·HV−99.8. (III) that hardness testing can be a straightforward and non-
Consequently, the obtained hardness and TS values are destructive method to estimate the TS of maraging steel.
consistent with those provided by the manufacturer and However, the YS is poorly estimated since the empirical
59
reported in the open literature, specifically: YS = 1000 ± correlation established by Pavlina and Tyne was limited
100 MPa and TS = 1100 ± 100 MPa, in the as-built and to YS up to 1700 MPa, and maraging steels were not
untreated state; YS = 1900 ± 100 MPa and TS = 1950 ± considered in the analysis.
100 MPa, in the age-hardened state. The results demonstrate 4. Conclusion
that the hardness test can, in a straightforward and non-
destructive way, be used to estimate the maraging steel TS; This article presents an evaluation of the quality of
the YS is poorly estimated, however, since the empirical 3D-printed maraging steel parts produced using LPBF
Volume 4 Issue 2 (2025) 11 doi: 10.36922/MSAM025040002