
Page 104 - MSAM-4-3
P. 104
Materials Science in Additive Manufacturing Heterostructures of A131 steel by DED
A B C
D E F
G H I
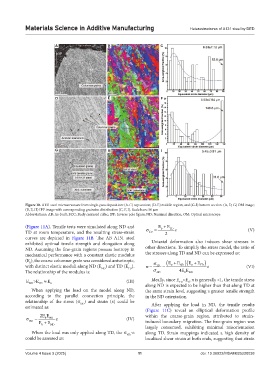
Figure 10. A131 steel microstructure from single-pass deposition: (A-C) top section; (D-E) middle region; and (G-I) bottom section. (A, D, G) OM image;
(B, E, H) IPF image with corresponding grainsize distribution (C, F, I). Scale bars: 50 µm
Abbreviations: AB: As-built; BCC: Body centered cubic; IPF: Inverse pole figure; ND: Nominal direction; OM: Optical microscope
(Figure 11A). Tensile tests were simulated along ND and E 0 E TD
TD at room temperature, and the resulting stress-strain TD 2 (V)
curves are depicted in Figure 11B. The AB A131 steel
exhibited optimal tensile strength and elongation along Uniaxial deformation also induces shear stresses in
ND. Assuming the fine-grain regions possess isotropy in other directions. To simplify the stress model, the ratio of
mechanical performance with a constant elastic modulus the stresses along TD and ND can be expressed as:
(E ), the coarse columnar grain was considered anisotropic, E E E E
0
with distinct elastic moduli along ND (E ) and TD (E ). n TD 0 ND 0 TD (VI)
ND
TD
The relationship of the modulus is: ND 4 EE ND
0
Ideally, since E ≈E , n is generally <1, the tensile stress
E>E TD ≈ E 0 (III) along ND is expected to be higher than that along TD at
TD
0
ND
When applying the load on the model along ND, the same strain level, suggesting a greater tensile strength
according to the parallel connection principle, the in the ND orientation.
relationship of the stress (σ ) and strain (ε) could be
ND
estimated as: After applying the load in ND, the tensile results
(Figure 11C) reveal an elliptical deformation profile
2 EE within the coarse-grain region, attributed to strain-
ND E 0 E ND (IV) induced boundary migration. The fine-grain region was
ND
0
largely consumed, exhibiting minimal misorientation
When the load was only applied along TD, the σ -ε along TD. Strain mappings indicated a high density of
ND
could be assessed as: localized shear strain at both ends, suggesting that strain
Volume 4 Issue 3 (2025) 11 doi: 10.36922/MSAM025220038