
Page 34 - MSAM-4-3
P. 34
Materials Science in Additive Manufacturing Numerical simulation of plasma WAAM for Ti-6Al-4V
A B
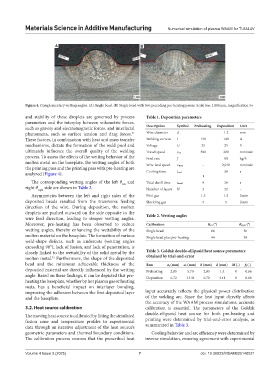
Figure 4. Complementary wetting angles. (A) Single bead. (B) Single bead with two preceding pre-heating passes. Scale bar: 1,000 µm, magnification 5×
and stability of these droplets are governed by process Table 1. Deposition parameters
parameters and the interplay between volumetric forces,
such as gravity and electromagnetic forces, and interfacial Description Symbol Preheating Deposition Unit
phenomena, such as surface tension and drag forces. Wire diameter d - 1.2 mm
31
These factors, in combination with heat and mass transfer Welding current I 130 140 A
mechanisms, dictate the formation of the weld pool and Voltage U 25 25 V
ultimately influence the overall quality of the welding Travel speed vTS 300 200 mm/min
process. To assess the effects of the wetting behavior of the Feed rate f - 0.9 kg/h
molten metal on the baseplate, the wetting angles of both Wire feed speed - 2,910 mm/min
the printing pass and the printing pass with pre-heating are vWFS
analyzed (Figure 4). Cooling time tcool 1 30 s
The corresponding wetting angles of the left θ and Total dwell time tdwell 9 38 s
left
right θ right side are shown in Table 2. Number of layers N 2 32 -
Asymmetries between the left and right sides of the Pilot gas 1.5 1.5 l/min
deposited beads resulted from the transverse feeding Shielding gas 5 5 l/min
direction of the wire. During deposition, the molten
droplets are pushed outward on the side opposite to the Table 2. Wetting angles
wire feed direction, leading to steeper wetting angles.
Moreover, pre-heating has been observed to reduce Calibration θleft (°) θright (°)
wetting angles, thereby enhancing the wettability of the Single bead 66 50
molten material on the baseplate. The formation of various Single bead plus pre-heating 44 38
weld-shape defects, such as undercuts (wetting angles
exceeding 90°), lack of fusion, and lack of penetration, is
closely linked to the wettability of the solid metal by the Table 3. Goldak double‑ellipsoid heat source parameters
molten metal. Furthermore, the shape of the deposited obtained by trial‑and‑error
31
bead and the minimum achievable thickness of the Run af (mm) ar (mm) b (mm) d (mm) M (‑) ff (‑)
deposited material are directly influenced by the wetting Preheating 2.85 5.70 2.85 1.4 0 0.66
angle. Based on these findings, it can be depicted that pre- Deposition 6.72 13.44 6.72 4.41 0 0.66
heating the baseplate, whether by hot plasma gas or heating
mats, has a beneficial impact on interlayer bonding,
improving the adhesion between the first deposited layer input accurately reflects the physical power distribution
and the baseplate. of the welding arc. Since the heat input directly affects
the accuracy of the WAAM process simulations, accurate
3.2. Heat source calibration calibration is essential. The parameters of the Goldak
The moving heat source is calibrated by fitting the simulated double-ellipsoid heat source for both pre-heating and
fusion zone and temperature profiles to experimental printing were determined by trial-and-error analysis, as
data through an iterative adjustment of the heat source’s summarized in Table 3.
geometric parameters and thermal boundary conditions. Cooling behavior and arc efficiency were determined by
The calibration process ensures that the prescribed heat inverse simulation, ensuring agreement with experimental
Volume 4 Issue 3 (2025) 7 doi: 10.36922/MSAM025140021