
Page 49 - MSAM-4-3
P. 49
Materials Science in Additive Manufacturing AI-driven defect detection in metal AM
Figure 2. Loss (left) and accuracy plot (right) of the ResNet50 model
Figure 3. Loss (left) and accuracy plot (right) of the EfficientNetV2B0 model
bounding box loss (train/box_loss and val/box_loss) and
object loss (train/obj_loss and val/obj_loss) both gradually
decrease in the training and validation sets, indicating that
the model is continuously optimizing and learning. The
model demonstrates good adaptability in distinguishing
between foreground objects and the background. While
the training loss is relatively smooth, the validation loss
exhibits some fluctuation, which may be attributed to
variations in the validation data. The classification loss
remains zero throughout the training process, as the
dataset consists of a single-class object detection task. As
training progresses, precision and recall steadily increase,
with the precision-recall curve stabilizing at a high level
of around 0.8. This suggests that most predicted positive
samples are correct, with a low false positive rate. The recall
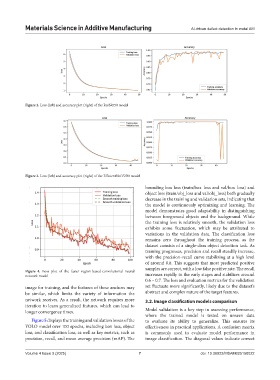
Figure 4. Loss plot of the faster region-based-convolutional neural
network model increases rapidly in the early stages and stabilizes around
0.6 – 0.7. The loss and evaluation metrics for the validation
image for training, and the features of these anchors may set fluctuate more significantly, likely due to the dataset’s
be similar, which limits the variety of information the abstract and complex nature of the target features.
network receives. As a result, the network requires more 3.2. Image classification models comparison
iteration to learn generalized features, which can lead to
longer convergence times. Model validation is a key step in assessing performance,
where the trained model is tested on unseen data
Figure 5 displays the training and validation losses of the to evaluate its ability to generalize. This ensures its
YOLO model over 100 epochs, including box loss, object effectiveness in practical applications. A confusion matrix
loss, and classification loss, as well as key metrics, such as is commonly used to evaluate model performance in
precision, recall, and mean average precision (mAP). The image classification. The diagonal values indicate correct
Volume 4 Issue 3 (2025) 7 doi: 10.36922/MSAM025150022