
Page 52 - MSAM-4-3
P. 52
Materials Science in Additive Manufacturing AI-driven defect detection in metal AM
Table 7. Evaluation results of Faster R‑CNN and YOLOv5
models
Parameter Specification
Faster R‑CNN YOLOv5
mAP (%) 46.25 81.5
Test precision (%) 47.68 79.7
Test recall (%) 53.52 75.0
Ground truth objects 482 -
Detected objects 1112 -
Inference time/image (s) 1 – 2 0.5 – 1
Abbreviation: mAP: Mean average precision,
R-CNN: region-based-Convolutional neural network.
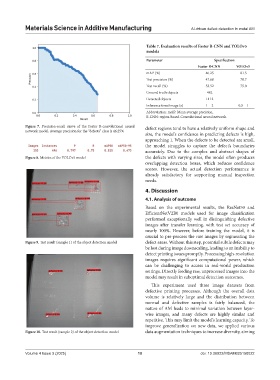
Figure 7. Precision-recall curve of the Faster R-convolutional neural defect regions tend to have a relatively uniform shape and
network model. Average precision for the “defects” class is 46.25%
size, the model’s confidence in predicting defects is high,
approaching 1. When the defects to be detected are small,
the model struggles to capture the defect’s boundaries
accurately. Due to the complex and abstract shapes of
Figure 8. Metrics of the YOLOv5 model the defects with varying sizes, the model often produces
overlapping detection boxes, which reduces confidence
scores. However, the actual detection performance is
already satisfactory for supporting manual inspection
needs.
4. Discussion
4.1. Analysis of outcome
Based on the experimental results, the ResNet50 and
EfficientNetV2B0 models used for image classification
performed exceptionally well in distinguishing defective
images after transfer learning, with test set accuracy of
nearly 100%. However, before training the model, it is
crucial to pre-process the raw images by segmenting the
Figure 9. Test result (sample 1) of the object detection model defect areas. Without this step, potential subtle defects may
be lost during image downscaling, leading to an inability to
detect printing issues promptly. Processing high-resolution
images requires significant computational power, which
can be challenging to access in real-world production
settings. Directly feeding raw, unprocessed images into the
model may result in suboptimal detection outcomes.
This experiment used three image datasets from
defective printing processes. Although the overall data
volume is relatively large and the distribution between
normal and defective samples is fairly balanced, the
nature of AM leads to minimal variation between layer-
wise images, and many defects are highly similar and
repetitive. This may limit the model’s learning capacity. To
improve generalization on new data, we applied various
Figure 10. Test result (sample 2) of the object detection model data augmentation techniques to increase diversity, aiming
Volume 4 Issue 3 (2025) 10 doi: 10.36922/MSAM025150022