
Page 51 - TD-2-3
P. 51
Tumor Discovery CE-SWI in desmoid fibromatosis assessment
from CE-SWI and T2-STIR sequences. mChoi values were of 50% were considered thresholds for progression and
estimated as a normalization quotient obtained by dividing an response, respectively, for 3D volumetric assessment [11,31] .
entire desmoid lesion’s mean 3D intensity value by the adjacent
standard muscle intensity value [6,11,27] . An IBSI-compliant [28,29] 3. Results
open-source in-house developed software (CARPI-AF: This study included eight female and two male patients
Cancer Radiomic and Perfusion Imaging Automated with an average age of 42 years (range 19 – 61 years). Five
Framework) was used to automatically extract five first- patients were treated with sorafenib, two with pazopanib,
order radiomic features (mean, skewness, kurtosis, 10 and and three were undergoing active surveillance without
th
90 percentiles) from the CE-SWI and T2 images. Before therapy. Given the reduced pilot study sample size, we did
th
radiomic feature extraction, all images were preprocessed in not include an analysis of therapeutic efficacy but focused
CARPI-AF by performing interpolation to isotropic voxel on the development of imaging biomarkers.
spacing of 1 mm using B-spline and discretization using a
fixed histogram bin count of 50 . Finally, for each patient, Of the 10 patients, two were considered true progression
[30]
the percentage of voxels accumulated below the 10 and above based on T2-based RECIST, while eight were deemed
th
the 90 percentiles (10 and 90 percentile proportions) were stable. No true T2-RECIST-based positive responses were
th
th
th
computed for the 10 and 90 percentile cutoffs at the first- included in this pilot study.
th
th
time point in the patient’s treatment.
3.1. True T2-based RECIST progression
Patient response was assessed using conventional
RECIST as a reference standard and compared against Two patients displayed true progression based on the
T2-STIR and CE-SWI volumetric assessment, mChoi, first- T2-based RECIST reference standard (Figure 2, left
order radiomic features, and routine radiologic reporting panels). This same result was detected by CE-SWI volume
(RRR). Thresholds for progression and response were set at and mChoi at an average of 4.5 months earlier than
20% and 30% for unidimensional RECIST and volumetric T2-based RECIST. According to RRR, CE-SWI volume,
mChoi assessments . An increase of 25% and a decrease and mChoi, both cases were assessed as progressive. In
[11]
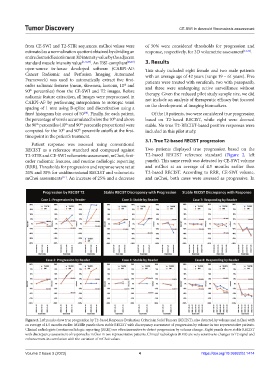
Figure 2. Left panels show true progression by T2-based Response Evaluation Criteria in Solid Tumors (RECIST), also detected by volume and mChoi with
an average of 4.5 months earlier. Middle panels show stable RECIST with discrepancy assessment of progression by volume in two representative patients.
Clinical radiologists (routine radiologic reporting [RRR]) are often insensitive to detect progression by volume change. Right panels show stable RECIST
with discrepancy assessment of response by mChoi in two representative patients. Clinical radiologists (RRR) are very sensitive to changes in T2 signal and
enhancement in correlation with the variation of mChoi values.
Volume 2 Issue 3 (2023) 4 https://doi.org/10.36922/td.1414