
Page 52 - TD-2-3
P. 52
Tumor Discovery CE-SWI in desmoid fibromatosis assessment
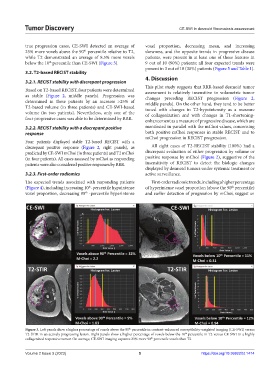
true progression cases, CE-SWI detected an average of voxel proportion, decreasing mean, and increasing
23% more voxels above the 90 percentile relative to T2, skewness, and the opposite trends in progressive disease
th
while T2 demonstrated an average of 8.5% more voxels patients, were present in at least one of these features in
below the 10 percentile than CE-SWI (Figure 3). 9 out of 10 (90%) patients; all four expected trends were
th
present in 3 out of 10 (30%) patients (Figure 5 and Table 1).
3.2. T2-based RECIST stability
4. Discussion
3.2.1. RECIST stability with discrepant progression
This pilot study suggests that RRR-based desmoid tumor
Based on T2-based RECIST, four patients were determined assessment is relatively insensitive to volumetric tumor
as stable (Figure 2, middle panels). Progression was changes preceding RECIST progression (Figure 2,
determined in these patients by an increase >25% of middle panels). On the other hand, they tend to be better
T2-based volume (in three patients) and CE-SWI-based tuned with changes in T2-hypointensity as a measure
volume (in two patients). Nevertheless, only one of the of collagenization and with changes in T1-shortening-
four progressive cases was able to be determined by RRR. enhancement as a measure of progressive disease, which are
3.2.2. RECIST stability with a discrepant positive manifested in parallel with the mChoi values, concerning
response both positive mChoi responses in stable RECIST and to
mChoi progression in RECIST progression.
Four patients displayed stable T2-based RECIST with a
discrepant positive response (Figure 2, right panels), as All eight cases of T2-RECIST stability (100%) had a
predicted by CE-SWI mChoi (in three patients) and T2 mChoi discrepant evaluation of either progression by volume or
(in four patients). All cases assessed by mChoi as responding positive response by mChoi (Figure 2), suggestive of the
patients were also considered positive responses by RRR. insensitivity of RECIST to detect the biologic changes
displayed by desmoid tumors under systemic treatment or
3.2.3. First-order radiomics active surveillance.
The expected trends associated with responding patients First-order radiomic trends, including a higher percentage
(Figure 4), including increasing 10 -percentile hypointense of hyperintense voxel proportion (above the 90 percentile)
th
th
voxel proportion, decreasing 90 -percentile hyperintense and earlier detection of progression by mChoi, suggest an
th
Figure 3. Left panels show a higher percentage of voxels above the 90 percentile in contrast-enhanced susceptibility-weighted imaging (CE-SWI) versus
th
T2-STIR in an actively progressing lesion. Right panels show a higher percentage of voxels below the 10 percentile in T2 versus CE-SWI in a highly
th
collagenized responsive tumor. On average, CE-SWI imaging captures 23% more 90 percentile voxels than T2.
th
Volume 2 Issue 3 (2023) 5 https://doi.org/10.36922/td.1414