
Page 34 - TD-3-2
P. 34
Tumor Discovery Immunophenotypic patterns of childhood acute leukemia
Table 3: Clinical manifestations in different groups of AL patients based on immunophenotype between January 2019 and June 2021
Clinical features B‑ALL (%) T‑ALL (%) AML (%) MPAL (%) p‑value
Fever 80 100 53.3 81.8 0.071
Bone pain 42.9 71.3 40 36.4 0.473
Weight loss 85.7 100 80 81.8 0.647
Loss of appetite 85.7 100 86.6 90.9 0.739
Fatigue/weakness 94.3 100 86.7 90.9 0.675
Paleness/anemia 97.1 100 100 90.9 0.547
Hepatomegaly 57.5 71.4 33.3 54.5 0.316
Splenomegaly 51.4 85.7 33.3 54.5 0.151
Lymphadenopathy 37.1 57.1 13.3 54.5 0.098
Abbreviations: AL: Acute leukemia; ALL: Acute lymphoblastic leukemia; AML: Acute myeloid leukemia; B-ALL: B-cell acute lymphoblastic leukemia;
MPAL: Mixed phenotypic acute leukemia; T-ALL: T-cell acute lymphoblastic leukemia.
Table 4: Hematological profiles in different groups of AL patients based on immunophenotype between January 2019 and June 2021
Laboratory parameters B‑ALL T‑ALL AML MPAL P‑value
3
TLC (10 /µL) 5,100 (3,300 – 19,400) 62,000 (9,140 – 94,100) 8,500 (4,200 – 27,500) 17,200 (7,700 – 30,000) 0.031*
RBC (10 /µL) 2.7 (2.2 – 3.1) 2.7 (2.5 – 3.0) 2.4 (2.2 – 3.1) 2.4 (1.9 – 3.4) 0.725
9
Hb (g/dL) 7.5 (6.5 – 9.3 7.2 (6.2 – 8.8) 7.2 (6.4 – 9.4) 6.8 (5.8 – 9.2) 0.971
Hematocrit (L/L) 0.22 (0.19 – 0.28) 0.22 (0.21 – 0.29) 0.24 (0.2 – 0.28) 0.22 (0.18 – 0.32) 0.868
6
Platelets (10 /µL) 31,000 (20 000 – 60,000) 27,000 (17,000 – 68,000) 38,000 (12,000 – 66,000) 31,000 (16,000 – 49,000) 0.876
PS blast 52 (21 – 80) 82 (37 – 97) 59 (28 – 76) 60 (38 – 80) 0.362
BMA blast 95 (90 – 98) 98 (98 – 98) 93.5 (70 – 98) 72.5 (0 – 98) 0.282
Note: *P<0.05.
Abbreviations: AL: Acute leukemia; ALL: Acute lymphoblastic leukemia; AML: Acute myeloid leukemia; B-ALL: B-cell acute lymphoblastic
leukemia; BMA: Bone marrow aspirate; Hb: Hemoglobin; MPAL: Mixed phenotypic acute leukemia; PS: Peripheral blood smears; T-ALL: T-cell acute
lymphoblastic leukemia; TLC: Total leukocyte count; TRBC: Total red blood cell count.
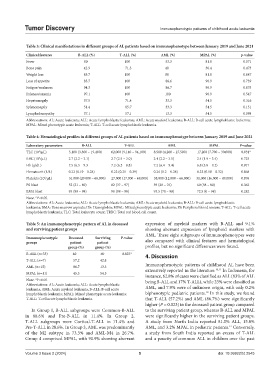
Table 5: An immunophenotypic pattern of AL in deceased expression of myeloid markers with B-ALL and 9.1%
and surviving patient groups showing aberrant expression of lymphoid markers with
AML. These eight subgroups of immunophenotypes were
Immunophenotypic Deceased Surviving P‑value
groups patient patient also compared with clinical features and hematological
group (%) group (%) profiles, but no significant differences were found.
B-ALL (n=35) 40 60 0.023* 4. Discussion
T-ALL (n=7) 57.2 42.8
AML (n=15) 86.7 13.3 Immunophenotypic patterns of childhood AL have been
10,11
MPAL (n=11) 45.5 54.5 extensively reported in the literature. In Indonesia, for
instance, 62.8% of cases were classified as ALL (83% of ALL
Note: *P<0.05. being B-ALL and 17% T-ALL), while 23% were classified as
Abbreviations: AL: Acute leukemia; ALL: Acute lymphoblastic AML, and 7.9% were of unknown origin, with only 0.2%
leukemia; AML: Acute myeloid leukemia; B-ALL: B-cell acute
10
lymphoblastic leukemia; MPAL: Mixed phenotypic acute leukemia; biphenotypic pediatric patients. In this study, we found
T-ALL: T-cell acute lymphoblastic leukemia. that T-ALL (57.2%) and AML (86.7%) were significantly
higher (P = 0.023) in the deceased patient group compared
In Group I, B-ALL subgroups were Common-B-ALL to the surviving patient group, whereas B-ALL and MPAL
in 88.6% and Pre-B-ALL in 11.4%. In Group 2, were significantly higher in the surviving patient groups.
T-ALL subgroups were Cortical-T-ALL in 71.4% and A study from North India reported 81.0% ALL, 15.8%
Pre-T-ALL in 28.6%. In Group 3, AML was predominantly AML, and 3.2% MPAL in pediatric patients. Conversely,
12
of the M2 subtype in 73.3% and AML-M4 in 26.7%. a study from South India reported an excess of T-ALL
Group 4 comprised MPAL, with 90.9% showing aberrant and a paucity of common ALL in children over the past
Volume 3 Issue 2 (2024) 5 doi: 10.36922/td.2545