
Page 33 - TD-3-2
P. 33
Tumor Discovery Immunophenotypic patterns of childhood acute leukemia
Table 2: (Continued) (8 [6 – 12]), AML (5 [4.5 – 6]), and MPAL (8 [5 – 10]); the
difference was not statistically significant.
S. No. Types of leukemias
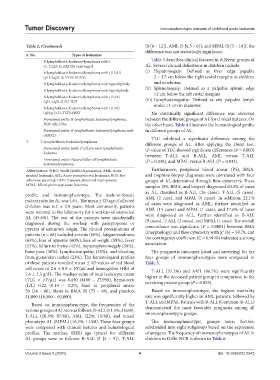
B-lymphoblastic leukemia/lymphoma with t Table 3 describes clinical features in different groups of
(v; 11q23.3); KMT2A rearranged AL. Several clinical definitions in children include:
B-lymphoblastic leukemia/lymphoma with t (12;21) (i) Hepatomegaly: Defined as liver edge papable
(p13.2;q22.1); ETV6‑RUNX1 2 – 3.5 cm below the right costal margins in children
B-lymphoblastic leukemia/lymphoma with hyperdiploidy and newborns
B-lymphoblastic leukemia/lymphoma with hypodiploidy (ii) Splenomegaly: Defined as a palpable splenic edge
>2 cm below the left costal margins
B-lymphoblastic leukemia/lymphoma with t (5;14)
(q31.1;q32.3) IL3‑IGH (iii) Lymphadenopathy: Defined as any palpable lymph
B-lymphoblastic leukemia/lymphoma with t (1;19) nodes >1 cm in diameter.
(q23;p13.3); TCF3‑PBX1 No statistically significant difference was observed
Provisional entity: B‑lymphoblastic leukemia/lymphoma, between the different groups of AL for clinical features. On
BCR‑ABL1‑like the other hand, Table 4 illustrates the hematological profile
Provisional entity: B‑lymphoblastic leukemia/lymphoma with in different groups of AL.
iAMP21
TLC exhibited a significant difference among the
3. T-lymphoblastic leukemia/lymphoma different groups of AL. After applying the Dunn test,
Provisional entity: Early T‑cell precursor lymphoblastic tP-value of TLC showed significant differences (P = 0.003)
leukemia between T-ALL and B-ALL, AML versus T-ALL
Provisional entity: Natural killer cell lymphoblastic (P = 0.038), and MPAL versus B-ALL (P = 0.041).
leukemia/lymphoma
Abbreviations: WHO: World Health Organization; AML: Acute Furthermore, peripheral blood smear (PS), BMA,
myeloid leukemia; APL: Acute promyelocytic leukemia; NOS: Not and trephine biopsy diagnoses were correlated with four
otherwise specified; TAM: Transient abnormal myelopoiesis; groups of AL determined through flow cytometry. These
MPAL: Mixed phenotype acute leukemia. samples (PS, BMA, and biopsy) diagnosed 60.3% of cases
as AL, classified as B-ALL (26 cases), T-ALL (5 cases),
profile, and immunophenotype. The male-to-female AML (1 case), and MPAL (9 cases). In addition, 22.1%
patient ratio for AL was 4.6:1. The mean ± SD age of affected of cases were diagnosed as AML, further identified as
children was 6.2 ± 2.9 years. Most commonly, patients AML (14 cases) and MPAL (1 case), and 17.6% of cases
were referred to the laboratory for a workup of suspected were diagnosed as ALL, further identified as B-ALL
AL (45.6%). The rest of the patients were incidentally (9 cases), T-ALL (2 cases), and MPAL (1 case). The overall
diagnosed during the workup with pancytopenia or
pyrexia of unknown origin. The clinical presentations of concordance was significant (P = 0.0001) between BMA
2
patients (n = 68) included anemia (66%), fatigue/weakness (morphology) and flow cytometry with χ (6) = 58.79, and
(63%), loss of appetite (60%), loss of weight (58%), fever the contingency coefficient (C = 0.9110) indicated a strong
(52%), failure to thrive (42%), hepatosplenomegaly (36%), association.
bone pain (30%), lymphadenopathy (25%), and bleeding The prognostic outcomes (dead and surviving) for the
from gums/skin rashes (23%). The hematological profiles four groups of immunophenotypes were compared in
of these patients revealed mean ± SD values of red blood Table 5.
cell count of 2.6 ± 0.9 × 10 /µL and hemoglobin (Hb) of T-ALL (57.2%) and AML (86.7%) were significantly
9
7.6 ± 2.3 g/dL. The median value of total leukocyte count higher in the deceased patient group in comparison to the
(TLC × 10 /µL) was 8,450 (4100 – 27,950), hematocrit surviving patient group (P = 0.023).
3
(L/L) 0.22 (0.19 – 0.29), blast in peripheral smear
59 (24 – 80), blasts in BMA 95 (75 – 98), and platelets Based on immunophenotype, the highest mortality
31,000 (18,500 – 60,000). rate was significantly higher in AML patients, followed by
T-ALL and MPAL. Patients with B-ALL (Common-B-ALL)
Based on immunophenotype, the frequencies of the
various groups of AL were as follows: B-ALL (51.5%; 35/68), demonstrated the most favorable prognosis among all
immunophenotypic groups.
T-ALL (10.3%; 07/68), AML (22%; 15/68), and mixed
phenotype AL (MPAL) (16.2%; 11/68). These four groups The immunophenotypic groups were, further,
were compared with clinical features and hematological subdivided into eight subgroups based on the expression
profiles. The median (IQR) age (years) for different of antigens. The frequency of immunophenotypes of AL in
AL groups were as follows: B-ALL (5 [4 – 9]), T-ALL children in Delhi-NCR is shown in Table 6.
Volume 3 Issue 2 (2024) 4 doi: 10.36922/td.2545