
Page 35 - TD-3-2
P. 35
Tumor Discovery Immunophenotypic patterns of childhood acute leukemia
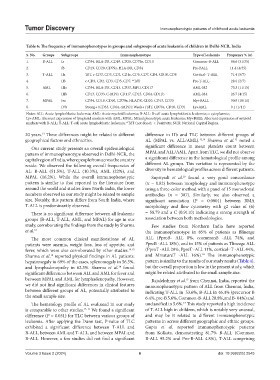
Table 6: The frequency of immunophenotypes in groups and subgroups of acute leukemia of children in Delhi‑NCR, India
S. No. Groups Subgroups Immunophenotype Type of leukemia Frequency % (n)
1. B-ALL Ia CD34, HLA-DR, CD19, CD20, CD79a, CD10 Common-B-ALL 88.6 (31/35)
2. Ib CD19, CD20, CD79a, HLA-DR, CD34 Pre-BALL 11.4 (4/35)
3. T-ALL IIa TdT, c-CD3, CD3, CD2, CD1a, CD5, CD7, CD4, CD10, CD8 Cortical- T-ALL 71.4 (5/7)
4. IIb c-CD3, CD2, CD3, CD5, CD7, *TdT Pre-T-ALL 28.6 (2/7)
5. AML IIIa CD34, HLA-DR, CD13, CD33, MPO, CD117 AML-M2 73.3 (11/15)
6. IIIb CD13, CD33, C-MPO, CD117, CD15, CD64, CD11b AML-M4 26.7 (4/15)
7. MPAL Iva CD34, CD19, CD10, CD79a, HLADR, CD20, CD13, CD33 My+BALL 90.9 (10/11)
8. IVb Strong+ (CD33, CD64, cMPO); Weak+ (TdT, CD79a, CD10, CD3) Ly+AML 9.1 (1/11)
Notes: ALL: Acute lymphoblastic leukemia; AML: Acute myeloid leukemia; B-ALL: B-cell acute lymphoblastic leukemia; c: cytoplasmic;
Ly+AML: Aberrant expression of lymphoid markers with AML; MPAL: Mixed phenotypic acute leukemia; My+BALL: Aberrant expression of myeloid
markers with B-ALL; T-ALL: T-cell acute lymphoblastic leukemia; *TdT (not done); +: Positivity; NCR: National Capital Region.
20 years. These differences might be related to different difference in Hb and TLC between different groups of
13
geographical factors and ethnicities. AL (MPAL vs. ALL/AML). 12,14 Sharma et al. noted a
12
Our current study presents an overall epidemiological significant difference in mean platelets count between
pattern of immunophenotype observed in Delhi-NCR, the MPAL and ALL/AML. Apart from TLC, we did not observe
capital region of India, where people from across the country a significant difference in the hematological profile among
reside. We observed the following overall frequencies of different AL groups. This variation is represented by the
AL: B-ALL (51.5%), T-ALL (10.3%), AML (22%), and diversity in hematological profiles across different patients.
MPAL (16.2%). While the overall immunophenotypic Supriyadi et al. found a very good concordance
10
pattern is similar to that reported in the literature from (κ = 0.82) between morphology and immunophenotype
around the world and studies from North India, the lower using a three-color method with a panel of 15 monoclonal
numbers observed in our study might be related to sample antibodies (n = 387). Similarly, we also observed a
size. Notably, this pattern differs from South India, where significant association (P = 0.0001) between BMA
T-ALL is predominantly observed. morphology and flow cytometry with χ2 value of (6)
There is no significant difference between all leukemic = 58.79 and a C (0.9110) indicating a strong strength of
groups (B-ALL, T-ALL, AML, and MPAL) for age in our association between both methodologies.
study, corroborating the findings from the study by Sharma Few studies from Northern India have reported
et al. 12 the immunophenotype in 85% of patients as Blineage
The most common clinical manifestations of AL ALL (PproB- ALL 8%, ccommonB -ALL 74%, and
patients were anemia, weight loss, loss of appetite, and PpreB -ALL 18%), and in 15% of patients as Tlineage ALL
fever, which were also corroborated by other studies. 14,15 (PproT -ALL 29%, PpreT -ALL 11%, cortical- T -ALL 44%,
16
Sharma et al. reported physical findings in AL patients: and MmatureT -ALL 16%). The immunophenotypic
12
hepatomegaly in 69% of the cases, splenomegaly in 56.5%, pattern is similar to the results of our study results (Table 4),
and lymphadenopathy in 62.3%. Sharma et al. found but the overall proportion is low in the present study, which
14
significant differences between ALL and AML for fever and might be related attributed to the small sample size.
between MPAL and AML for lymphadenopathy. However, Rajalekshmy et al. from Chennai, India, reported the
17
we did not find significant differences in clinical features immunophenotypic pattern of ALL from Chennai, India,
between different groups of AL, potentially attributed to indicating T-ALL in 53.6%, B-ALL in 46.4% (precursor B
the small sample size. 6.4%, pre-B 5.6%, Common-B-ALL 20.8%,and B- 04%) and
The hematology profile of AL evaluated in our study unclassified in 5.6%. This study reported a high incidence
17
is comparable to other studies. 13-15 We found a significant of T-ALL high in children, which is notably very unusual,
difference (P = 0.031) for TLC between various groups of and may be it related to different immunophenotypic
leukemia. After applying the Dunn test, P-value of TLC patterns in across different geographic and ethnic groups.
exhibited a significant difference between T-ALL and Gupta et al. reported immunophenotypic patterns
B-ALL, between AML and T-ALL, and between MPAL and from Kolkata, demonstrating 81.7% B-ALL (Common
B-ALL. However, a few studies did not find a significant B-ALL 95.2% and Pro-B-ALL 4.8%), T-ALL comprising
Volume 3 Issue 2 (2024) 6 doi: 10.36922/td.2545