
Page 80 - TD-4-1
P. 80
Tumor Discovery Colorectal cancer: miRNA, mRNA, protein insights
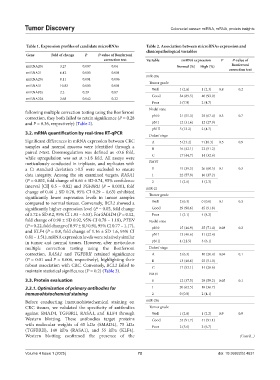
Table 1. Expression profiles of candidate microRNAs Table 2. Association between microRNAs expression and
clinicopathological variables
Gene Fold of change P P‑value of Bonferroni
correction test Variable miRNA expression P P‑value of
Bonferroni
miRNA20a 3.27 0.007 0.04 Normal (%) High (%) correction test
miRNA21 6.42 0.003 0.001
miR-20a
miRNA29a 8.11 0.001 0.006
Tumor grade
miRNA31 10.83 0.003 0.001
Well 1 (2.6) 1 (2.3) 0.8 0.2
miRNA92a 2.2 0.29 0.87
Good 34 (89.5) 40 (93.0)
miRNA224 2.68 0.042 0.22
Poor 3 (7.9) 2 (4.7)
Nodal state
following multiple correction testing using the Bonferroni
correction, they both failed to retain significance (P = 0.28 pN 0 21 (55.3) 29 (67.4) 0.3 0.7
and P = 0.36, respectively) (Table 2). pN I 12 (31.6) 12 (27.9)
pN II 5 (13.2) 2 (4.7)
3.2. mRNA quantification by real-time RT-qPCR
Dukes’ stage
Significant differences in mRNA expression between CRC A 5 (13.2) 7 (16.3) 0.5 0.9
samples and normal mucosa were identified through a B 16 (42.1) 22 (51.2)
paired t-test. Downregulation was defined as <0.6 fold,
while upregulation was set at >1.8 fold. All assays were C 17 (44.7) 14 (32.6)
meticulously conducted in triplicate, and replicates with EMVI
a Ct standard deviation >0.5 were excluded to ensure 0 15 (39.5) 26 (60.5) 0.1 0.3
data integrity. Among the six examined targets, RASA1 1 22 (57.9) 16 (37.2)
(P = 0.002, fold change of 0.66 ± SD 0.74, 95% confidence 2 1 (2.6) 1 (2.3)
interval [CI] 0.5 – 0.82) and TGFBRII (P = 0.0001, fold miR-21
change of 0.46 ± SD 0.78, 95% CI 0.29 – 0.63) exhibited
significantly lower expression levels in tumor samples Tumor grade
compared to normal tissues. Conversely, BCL2 showed a Well 2 (6.3) 0 (0.0) 0.1 0.3
significantly higher expression level (P = 0.05, fold change Good 29 (90.6) 45 (91.8)
of 3.72 ± SD 8.2, 95% CI 1.93 – 5.53). For SMAD4 (P = 0.12, Poor 1 (3.1) 4 (8.2)
fold change of 0.98 ± SD 0.92, 95% CI 0.78 – 1.18), PTEN Nodal state
(P = 0.22, fold change of 0.97 ± SD 0.91, 95% CI 0.77 – 1.17), pN 0 15 (46.9) 35 (71.4) 0.08 0.2
and KLF4 (P = 0.8, fold change of 1.16 ± SD 1.6, 95% CI
0.81 – 1.51), mRNA expression levels were relatively similar pN I 13 (40.6) 11 (22.4)
in tumor and normal tissues. However, after meticulous pN II 4 (12.5) 3 (6.1)
multiple correction testing using the Bonferroni Dukes’ stage
correction, RASA1 and TGFBRII retained significance A 2 (6.3) 10 (20.4) 0.04 0.1
(P = 0.01 and P = 0.006, respectively), highlighting their B 13 (40.6) 25 (51.0)
robust association with CRC. Conversely, BCL2 failed to C 17 (53.1) 14 (28.6)
maintain statistical significance (P = 0.2) (Table 3).
EMVI
3.3. Protein evaluation 0 12 (37.5) 29 (59.2) 0.05 0.1
3.3.1. Optimization of primary antibodies for 1 20 (62.5) 18 (36.7)
immunohistochemical staining 2 0 (0.0) 2 (4.1)
Before conducting immunohistochemical staining on miR-29a
CRC tissues, we validated the specificity of antibodies Tumor grade
against SMAD4, TGFBRII, RASA1, and KLF4 through Well 1 (2.8) 1 (2.2) 0.9 0.9
Western blotting. These antibodies target proteins Good 33 (91.7) 41 (91.1)
with molecular weights of 65 kDa (SMAD4), 75 kDa Poor 2 (5.6) 3 (6.7)
(TGFBRII), 140 kDa (RASA1), and 55 kDa (KLF4).
Western blotting confirmed the presence of the (Cont’d...)
Volume 4 Issue 1 (2025) 72 doi: 10.36922/td.4631