
Page 79 - TD-4-1
P. 79
Tumor Discovery Colorectal cancer: miRNA, mRNA, protein insights
A B C
D E F
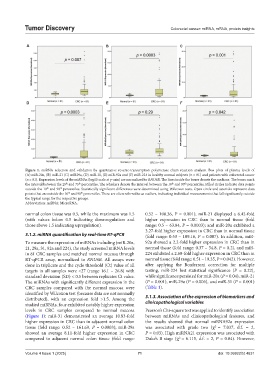
Figure 1. miRNA selection and validation by quantitative reverse-transcription polymerase chain reaction analysis. Box plots of plasma levels of
(A) miR-20a, (B) miR-21 (C) miR29a, (D) miR-31, (E) miR-92a and (F) miR-224 in healthy normal subjects (n = 81) and patients with colorectal cancer
(n = 81). Expression levels of the miRNAs (log10 scale at y-axis) are normalized to RNU6B. The lines inside the boxes denote the medians. The boxes mark
the interval between the 25 and 75 percentiles. The whiskers denote the interval between the 10 and 90 percentiles. Filled circles indicate data points
th
th
th
th
outside the 10 and 90 percentiles. Statistically significant differences were determined using Wilcoxon tests. Open circle and asterisks represent data
th
th
points that are outside the 10 and 90 percentiles. These are often referred to as outliers, indicating individual measurements that fall significantly outside
th
th
the typical range for the respective groups.
Abbreviation: miRNA: MicroRNA.
normal colon tissue was 0.5, while the maximum was 1.5 0.52 – 108.36, P = 0.001); miR-21 displayed a 6.42-fold
(with values below 0.5 indicating downregulation and higher expression in CRC than in normal tissue (fold
those above 1.5 indicating upregulation). range: 0.5 – 63.84, P = 0.0003); and miR-20a exhibited a
3.27-fold higher expression in CRC than in normal tissue
3.1.2. miRNA quantification by real-time RT-qPCR (fold range: 0.53 – 109.16, P = 0.007). In addition, miR-
To measure the expression of miRNAs including (miR-20a, 92a showed a 2.2-fold higher expression in CRC than in
21, 29a, 31, 92a and 224), the study screened miRNA levels normal tissue (fold range: 0.37 – 34.8, P = 0.2), and miR-
in 81 CRC samples and matched normal mucosa through 224 exhibited a 2.68-fold higher expression in CRC than in
RT-qPCR assay, normalized to RNU6B. All assays were normal tissue (fold range: 0.51 – 19.35, P = 0.042). However,
done in triplicate and the cycle threshold (Ct) value of all after applying the Bonferroni correction for multiple
targets in all samples were <27 (range 16.1 – 26.8) with testing, miR-224 lost statistical significance (P = 0.22),
standard deviation (SD) < 0.5 between replicates Ct value. while significance persisted for miR-20a (P = 0.04), miR-21
The miRNAs with significantly different expression in the (P = 0.001), miR-29a (P = 0.006), and miR-31 (P = 0.001)
CRC samples compared with the normal mucosa were (Table 1).
identified by Wilcoxon test (because data are not normally
distributed), with an expression fold >1.5. Among the 3.1.3. Association of the expression of biomarkers and
studied miRNAs, four exhibited notably higher expression clinicopathological variables
levels in CRC samples compared to normal mucosa Pearson’s Chi-square test was applied to identify association
(Figure 1): miR-31 demonstrated an average 10.83-fold between miRNAs and clinicopathological features, and
higher expression in CRC than in adjacent normal colon the results showed that normal miRNA92a expression
tissue (fold range: 0.52 – 161.69, P = 0.0003); miR-29a was associated with grade two (χ = 7.037, d.f. = 2,
2
showed an average 8.11-fold higher expression in CRC P = 0.03). High miRNA21 expression was associated with
compared to adjacent normal colon tissue (fold range: Duke’s B stage (χ = 6.115, d.f. = 2, P = 0.04). However,
2
Volume 4 Issue 1 (2025) 71 doi: 10.36922/td.4631