
Page 82 - TD-4-1
P. 82
Tumor Discovery Colorectal cancer: miRNA, mRNA, protein insights
3.3.2. Protein expression of target genes had a median H-score of 70 (range: 0 – 225), BCL2 had
In a primary operable invasive CRC patient cohort, a median H-score of 125 (range: 0 – 300), KLF4 had a
we conducted an evaluation to delve deeper into the median H-score of 90 (range: 0 – 300), and RASA1 had a
expression of miRNA target genes, including SMAD4, median H-score of 65 (range: 0 – 200).
PTEN, TGFBRII, BCL2, KLF4, and RASA1. Staining As previously mentioned, excellent concordance
patterns for all markers displayed heterogeneity both between scorers was observed, as indicated by the single-
within and between tumor cores, ranging from weak measure ICC for SMAD4, PTEN, TGFBRII, BCL2, KLF4,
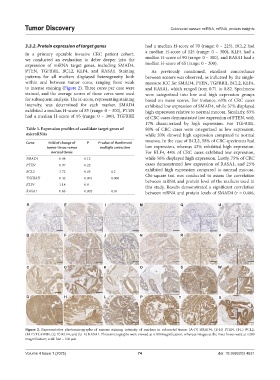
to intense staining (Figure 2). Three cores per case were and RASA1, which ranged from 0.71 to 0.82. Specimens
stained, and the average scores of these cores were used were categorized into low and high expression groups
for subsequent analysis. The H-score, representing staining based on mean scores. For instance, 63% of CRC cases
intensity, was determined for each marker. SMAD4 exhibited low expression of SMAD4, while 37% displayed
exhibited a median H-score of 85 (range: 0 – 300), PTEN high expression relative to normal mucosa. Similarly, 83%
had a median H-score of 95 (range: 0 – 300), TGFBRII of CRC cases demonstrated low expression of PTEN, with
17% characterized by high expression. For TGFBRII,
Table 3. Expression profiles of candidate target genes of 80% of CRC cases were categorized as low expression,
microRNAs while 20% showed high expression compared to normal
mucosa. In the case of BCL2, 58% of CRC specimens had
Gene Fold of change of P P‑value of Bonferroni
tumor tissue versus multiple correction low expression, whereas 42% exhibited high expression.
normal tissue For KLF4, 44% of CRC cases exhibited low expression,
SMAD4 0.98 0.12 while 56% displayed high expression. Lastly, 75% of CRC
PTEN 0.97 0.22 cases demonstrated low expression of RASA1, and 25%
BCL2 3.72 0.05 0.2 exhibited high expression compared to normal mucosa.
TGFBRII 0.46 0.001 0.006 Chi-square test was conducted to assess the correlation
between mRNA and protein level of the markers used in
KLF4 1.18 0.8 this study. Results demonstrated a significant correlation
RASA1 0.66 0.002 0.01 between mRNA and protein levels of SMAD4 (r = 0.466,
A E I M Q U
B F J N R V
C G K O S W
D H L P T X
Figure 2. Representative photomicrographs of various staining intensity of markers in colorectal tissue: (A-D) SMAD4, (E-H) PTEN, (I-L) BCL2,
(M-P) TGFBRII, (Q-T) KLF4, and (U-X) RASA1. Photomicrographs were viewed at ×100 magnification, whereas images at the inset boxes were at ×200
magnification; scale bar = 100 µm.
Volume 4 Issue 1 (2025) 74 doi: 10.36922/td.4631