
Page 67 - TD-4-2
P. 67
Tumor Discovery Glioblastoma treating fields system
A B
C D
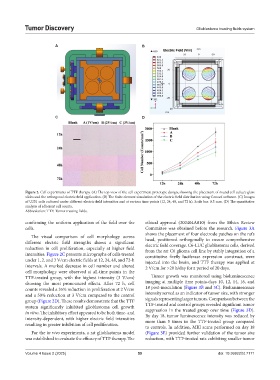
Figure 2. Cell experiments of TTF therapy. (A) The top view of the cell experiment prototype design, showing the placement of round cell culture glass
slides and the orthogonal electric field application. (B) The finite element simulation of the electric field distribution using Comsol software. (C) Images
of U251 cells cultured under different electric field intensities and at various time points (12, 24, 48, and 72 h). Scale bar: 0.5 mm. (D) The quantitative
analysis of adherent cell counts.
Abbreviation: TTF: Tumor treating fields.
confirming the uniform application of the field over the ethical approval (202404A010) from the Ethics Review
cells. Committee was obtained before the research. Figure 3A
shows the placement of four electrode patches on the rat’s
The visual comparison of cell morphology across head, positioned orthogonally to ensure comprehensive
different electric field strengths shows a significant electric field coverage. C6-LUC glioblastoma cells, derived
reduction in cell proliferation, especially at higher field from the rat C6 glioma cell line by stably integration of a
intensities. Figure 2C presents micrographs of cells treated constitutive firefly luciferase expression construct, were
under 1, 2, and 3 V/cm electric fields at 12, 24, 48, and 72-h injected into the brain, and TTF therapy was applied at
intervals. A marked decrease in cell number and altered 2 V/cm for >20 h/day for a period of 20 days.
cell morphology were observed at all-time points in the
TTF-treated group, with the highest intensity (3 V/cm) Tumor growth was monitored using bioluminescence
showing the most pronounced effects. After 72 h, cell imaging at multiple time points-days 10, 12, 14, 16, and
counts revealed a 35% reduction in proliferation at 2 V/cm 18 post-inoculation (Figure 3B and 3C). Bioluminescence
and a 50% reduction at 3 V/cm compared to the control intensity served as an indicator of tumor size, with stronger
group (Figure 2D). These results demonstrate that the TTF signals representing larger tumors. Comparison between the
system significantly inhibited glioblastoma cell growth TTF-treated and control groups revealed significant tumor
suppression in the treated group over time (Figure 3D).
in vitro. The inhibitory effect appeared to be both time- and By day 18, tumor luminescence intensity was reduced by
intensity-dependent, with higher electric field intensities
resulting in greater inhibition of cell proliferation. more than 5 times in the TTF-treated group compared
to controls. In addition, MRI scans performed on day 18
For the in vivo experiments, a rat glioblastoma model (Figure 3E) provided further validation of the tumor size
was established to evaluate the efficacy of TTF therapy. The reduction, with TTF-treated rats exhibiting smaller tumor
Volume 4 Issue 2 (2025) 59 doi: 10.36922/td.7171