
Page 76 - TD-4-2
P. 76
Tumor Discovery DRGs in HCC prognosis and immunity
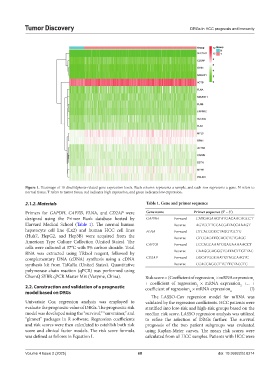
Figure 1. Heatmaps of 18 disulfidptosis-related gene expression levels. Each column represents a sample, and each row represents a gene. N refers to
normal tissue, T refers to tumor tissue, red indicates high expression, and green indicates low expression.
2.1.2. Materials Table 1. Gene and primer sequence
Primers for GAPDH, CAPZB, FLNA, and CD2AP were Gene name Primer sequence (5’ – 3’)
designed using the Primer Bank database hosted by GAPDH Forward CATGAGAAGTATGACAACAGCCT
Harvard Medical School (Table 1). The normal human Reverse AGTCCTTCCACGATACCAAAGT
hepatocyte cell line (Lx2) and human HCC cell lines FLNA Forward GTCACGGGCTAGGTGCTG
(Huh7, HepG2, and Hep3B) were acquired from the Reverse GTCCACATCCACCTCTGAGC
American Type Culture Collection (United States). The CAPZB Forward CCCAGCAAATCGAGAAAAACCT
cells were cultured at 37°C with 5% carbon dioxide. Total
RNA was extracted using TRIzol reagent, followed by Reverse CAAGGGAGGGTCATACTTGTTAC
complementary DNA (cDNA) synthesis using a cDNA CD2AP Forward GGCATGGGAATGTAGCAAGTC
synthesis kit from TaKaRa (United States). Quantitative Reverse CCACCAGCCTTCTTCTACCTC
polymerase chain reaction (qPCR) was performed using
ChamQ SYBR qPCR Master Mix (Vazyme, China). Risk score = (Coefficient of regression × mRNA expression
1
1
+ coefficient of regression × mRNA expression +... +
2
2.2. Construction and validation of a prognostic coefficient of regression × mRNA expression 2 (I)
model based on DRGs n n
The LASSO-Cox regression model for mRNA was
Univariate Cox regression analysis was employed to validated by the regression coefficients. HCC patients were
evaluate the prognostic value of DRGs. The prognostic risk stratified into low-risk and high-risk groups based on the
model was developed using the “survival,” “survminer,” and median risk score. LASSO regression analysis was utilized
“glmnet” packages in R software. Regression coefficients to refine the selection of DRGs further. The survival
and risk scores were then calculated to establish both risk prognosis of the two patient subgroups was evaluated
score and clinical factor models. The risk score formula using Kaplan-Meier curves. The mean risk scores were
was defined as follows in Equation I. calculated from all HCC samples. Patients with HCC were
Volume 4 Issue 2 (2025) 68 doi: 10.36922/td.8214